


September 17, 2025
Editorial Policy
All of our content is generated by subject matter experts with years of ad tech experience and structured by writers and educators for ease of use and digestibility. Learn more about our rigorous interview, content production and review process here.

Key Points
- Geography trumps everything else in eCPM performance. An app with 80% Tier 1 traffic generates roughly 3x the revenue of an identical app with 20% Tier 1 traffic, making user location more critical than download counts, engagement metrics, or app store ratings.
- Realistic eCPM expectations vary dramatically by format and region. Tier 1 countries see banner eCPMs of $0.50-$1.50, interstitials at $5.00-$8.00, and rewarded video at $15.00-$30.00, while global averages drop to $0.20-$0.80, $2.50-$5.00, and $8.00-$18.00 respectively.
- Gaming apps dominate mobile monetization opportunities despite representing a smaller percentage of total applications. Gaming eCPMs run 20-30% higher than other categories because users expect interruptions, rewards, and interface elements that don't translate to productivity or utility apps.
- Revenue scaling follows predictable but non-linear patterns influenced by factors outside publisher control. Seasonal fluctuations, competitive pressure, technical issues, and user behavior changes mean smart publishers plan for 70-80% of calculator estimates and treat anything above as bonus revenue.
- AdMob-only implementations represent performance ceilings, not monetization potential. Publishers using sophisticated mediation strategies typically achieve 40-60% higher revenue than single-platform approaches by creating competitive auction environments where multiple advertisers bid for the same inventory.
Most publishers approach AdMob eCPM expectations like they're planning a lottery win, wildly optimistic and mildly divorced from reality.
Here's what actually happens when real apps meet real users in real markets with real advertiser demand. The numbers are lower than your dreams but higher than your fears, if you know what you're doing.

The Geographic Reality That Controls Revenue Projections
Geography matters more than your download count, user engagement, or app store rating. An app with 80% Tier 1 traffic generates roughly 3x the revenue of an identical app with 20% Tier 1 traffic.
Tier 1 Country eCPM Benchmarks
Based on industry data and advertiser demand patterns, here's what publishers actually see:
- Banner Ads: $0.50-$1.50 eCPM in US, UK, Canada, Australia, Germany, France, Japan. Sounds pathetic until you remember banners generate dozens of impressions per session while other formats generate one.
- Interstitial Ads: $5.00-$8.00 eCPM for the same geographic regions. Video interstitials command 40-60% premiums over static versions because moving pictures are harder to mentally dismiss.
- Rewarded Video: $15.00-$30.00 eCPM when properly implemented. The highest rates come from gaming apps where users understand the value exchange psychology.
Global Average Reality Check
Most apps serve global audiences, which means your actual eCPMs look very different from Tier 1 benchmarks.
- Banner Global Average: $0.20-$0.80 eCPM. Still adds up through volume if you understand persistent advertising psychology.
- Interstitial Global Average: $2.50-$5.00 eCPM. Timing matters more than creative quality for global audiences.
- Rewarded Video Global Average: $8.00-$18.00 eCPM. Users worldwide appreciate voluntary engagement over forced advertising exposure.
App Category eCPM Performance Hierarchy
Not all apps are created equal in the mobile monetization ecosystem. Some categories naturally command premium rates while others struggle with advertiser indifference.
Gaming Apps: The eCPM Champions
Gaming apps represent 75% of mobile monetization opportunities despite being a smaller percentage of total applications. Why? Advertiser psychology and user behavior patterns.
Gaming eCPM Premiums:
- Banner ads: 20-30% higher than average due to user acceptance of persistent interface elements
- Interstitials: Premium rates because users expect transitions between levels and activities
- Rewarded video: Often hits $40+ eCPM with proper implementation because users want in-game rewards
The Gaming Advantage: Users expect interruptions, rewards, and interface elements that don't exist in productivity or utility applications.
Non-Gaming Category Performance
- Social/Entertainment Apps: Strong session lengths support multiple ad exposures. Users consume content voluntarily, creating receptive advertising environments.
- Productivity/Utility Apps: Lower session frequency limits impression volume. Users resist interruptions during task completion, requiring careful ad placement.
- News/Information Apps: Commoditized content creates price pressure. Users consume quickly and leave, limiting monetization windows.
The DAU-to-Revenue Translation Formula
Daily Active Users don't directly translate to revenue without understanding engagement patterns, geographic distribution, and monetization implementation quality.
Sample Revenue Projections
Gaming App Example (5,000 DAU, 60% Tier 1 traffic):
- Optimistic implementation: $150-250 daily revenue
- Conservative implementation: $100-175 daily revenue
- Poor implementation: $50-100 daily revenue
Global Gaming App (5,000 DAU, 20% Tier 1 traffic):
- Optimistic implementation: $75-125 daily revenue
- Conservative implementation: $50-90 daily revenue
- Poor implementation: $25-60 daily revenue
Utility App (5,000 DAU, 60% Tier 1 traffic):
- Optimistic implementation: $75-125 daily revenue
- Conservative implementation: $50-90 daily revenue
- Poor implementation: $25-75 daily revenue

The Scaling Reality
Revenue scaling isn't linear. Understanding the curve separates successful publishers from perpetual strugglers.
- 0-1K DAU: Small-sample statistical noise creates false optimism about scalability potential.
- 1K-10K DAU: eCPMs normalize as sample sizes increase. Most publishers realize initial projections were fantasy-based.
- 10K-100K DAU: Sufficient volume for meaningful optimization. Publishers who understand their data start pulling ahead.
- 100K+ DAU: Single-platform limitations become apparent. Sophisticated publishers expand beyond AdMob's ecosystem.
Seasonal and Timing Factors Affecting eCPMs
eCPMs fluctuate based on advertiser spending patterns that operate completely outside individual publisher control.
👉 AdMob Revenue Calculator: Estimate Your App's Earning Potential
Quarterly Performance Patterns
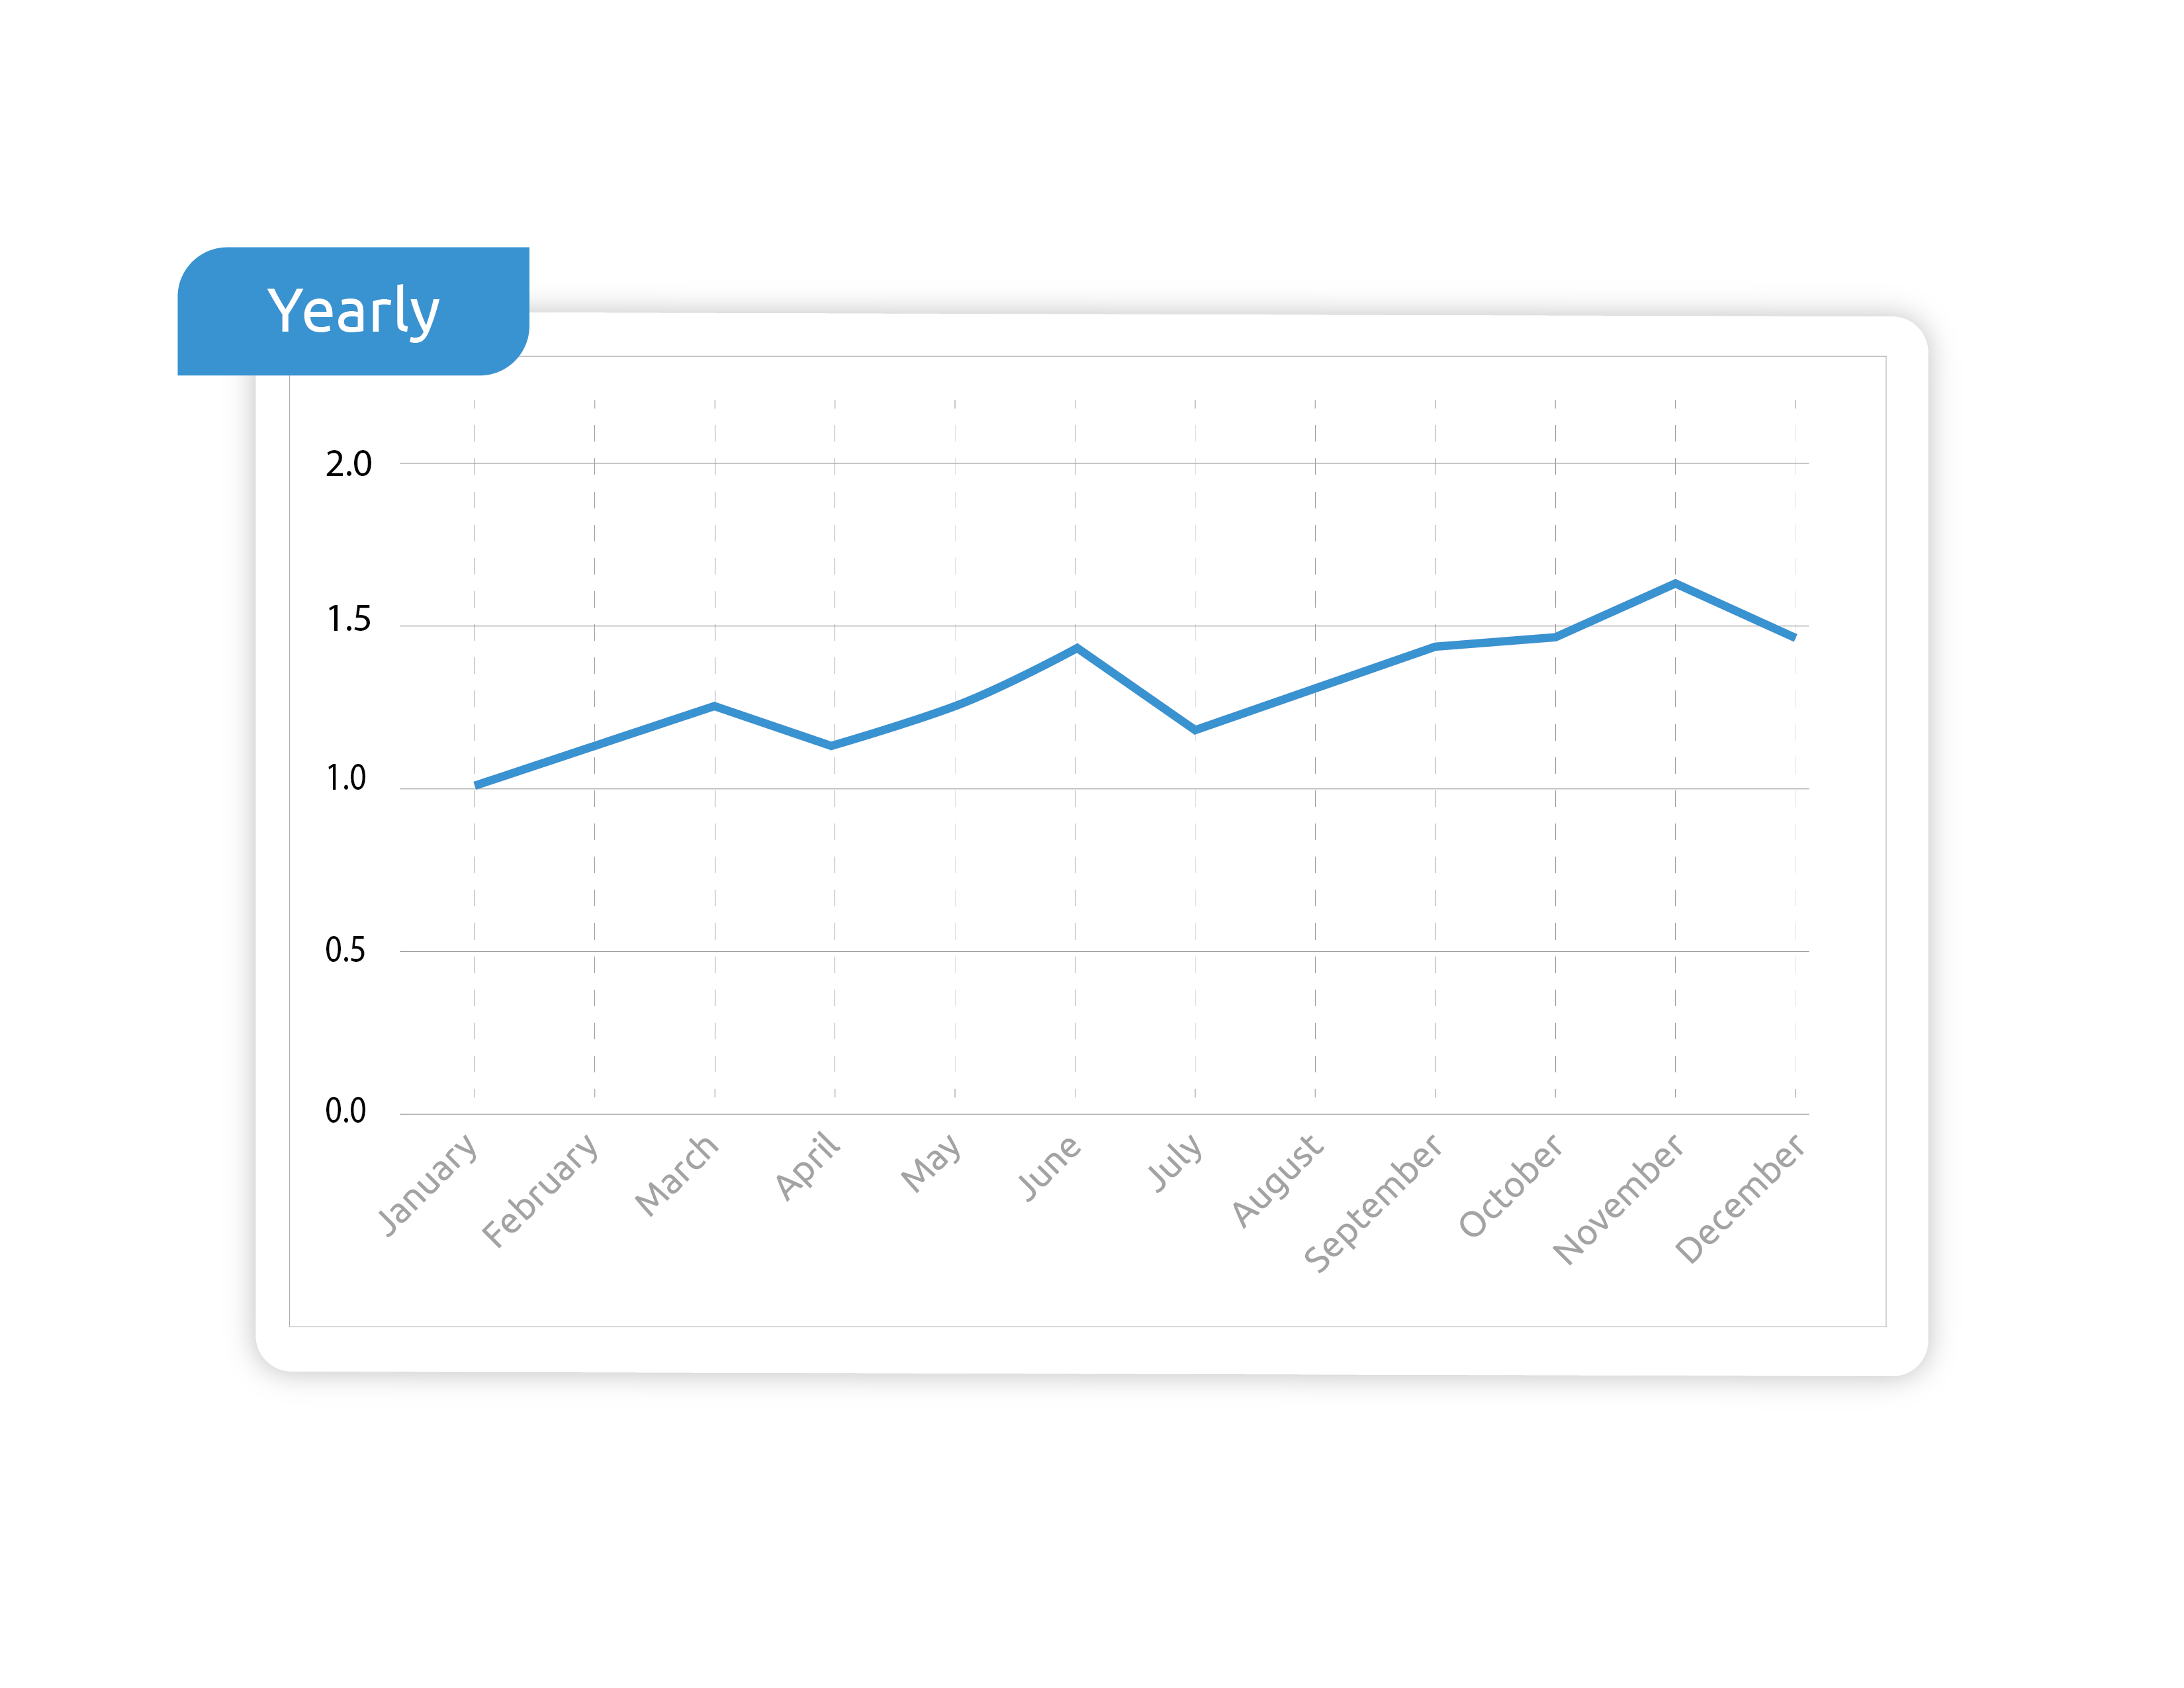
- Q4 Holiday Boost: November-December typically generates higher eCPMs due to holiday advertising spend. January shows the year's lowest rates as advertisers reset budgets.
- Back-to-School Surge: September often delivers strong performance for education, productivity, and family-focused applications.
- Summer Slump: June-August can show decreased performance as advertiser attention shifts to other channels and audiences.
Daily and Hourly Variations
- Peak Hours: 7-9 PM local time typically generates highest eCPMs as users have leisure time for app engagement.
- Weekday vs. Weekend: Performance varies by app category. Productivity apps perform better weekdays while entertainment apps excel on weekends.
- Geographic Time Zones: Global apps see performance fluctuations as different regions enter peak usage hours.
Fill Rate Reality Across Geographic Regions
Fill rates, the percentage of ad requests successfully filled with ads, vary dramatically based on user geography and advertiser demand patterns.
Regional Fill Rate Expectations
- Heavy Tier 1 Traffic (80%+): 85-95% fill rates are achievable across all ad formats.
- Mixed Global Traffic (50% Tier 1): 70-85% fill rates represent realistic expectations.
- Emerging Market Focus (20% Tier 1): 50-70% fill rates are common due to limited advertiser demand.
Why Fill Rates Matter More Than eCPMs
A 60% fill rate with engaged users often generates more revenue than a 90% fill rate with users who abandon your app. Focus on user lifetime value, not just advertising metrics.
The 70-80% Revenue Rule
Smart publishers plan for 70-80% of calculator estimates and treat anything above as bonus revenue. Why? Because most variables affecting mobile ad revenue operate outside publisher control.
Factors That Reduce Actual vs. Projected Revenue
- Seasonal Fluctuations: Q1 advertising budgets reset. Summer campaigns shift focus. Holiday spending concentrates in limited time windows.
- Competitive Pressure: New apps launch. Existing apps optimize. Advertiser preferences change based on campaign performance across the entire ecosystem.
- Technical Issues: SDK updates break implementations. Network connectivity affects ad serving. Device compatibility creates performance variations.
- User Behavior Changes: App store algorithm updates affect discovery. Competitor launches change user habits. External events influence app usage patterns.
Advanced eCPM Optimization Factors
Publishers who understand these factors consistently outperform those who don't.
Ad Format Mix Strategy
- Sequential Format Implementation: Start with banners for consistent revenue baseline. Add interstitials at natural transition points. Introduce rewarded video for premium monetization opportunities.
- Format Coordination: Coordinate timing between different ad formats to avoid overwhelming users while maximizing session-level revenue generation.

Visit the complete resource center for everything AdMob.
User Experience Balance
- Retention vs. Revenue: Aggressive monetization that maximizes short-term eCPMs often reduces user retention and lifetime value in ways that destroy long-term business sustainability.
- Engagement Quality: Users who enjoy your app tolerate more advertising than frustrated users. Focus on app quality alongside monetization optimization.
Beyond AdMob eCPM Limitations
Understanding AdMob benchmarks helps set realistic expectations, but these numbers represent single-platform performance ceilings rather than mobile monetization potential.
The Multi-Platform Reality
Publishers using sophisticated mediation strategies typically achieve 40-60% higher revenue than AdMob-only implementations by creating competitive auction environments where multiple advertisers bid for the same inventory.
The Technical Complexity Challenge: Managing multiple advertising SDKs, coordinating auction waterfalls, handling payment reconciliation across multiple networks, and maintaining user experience quality requires expertise most app developers lack.
Set Realistic eCPM Expectations
AdMob eCPM benchmarks provide useful baseline projections, but actual performance depends on geographic distribution, app category alignment, implementation quality, and ongoing optimization that most publishers underestimate.
The most successful mobile publishers use eCPM benchmarks as starting points for strategic planning rather than guaranteed outcomes for business modeling. They understand that sustainable monetization requires balancing short-term revenue optimization with long-term user satisfaction.
Ready to exceed basic AdMob eCPM benchmarks? Playwire's Revenue Amplification Management Platform optimizes eCPMs across multiple demand sources while maintaining user experiences that drive sustainable revenue growth.
Contact Playwire today to amplify your mobile advertising revenue.
