


June 27, 2023
Editorial Policy
All of our content is generated by subject matter experts with years of ad tech experience and structured by writers and educators for ease of use and digestibility. Learn more about our rigorous interview, content production and review process here.

Key Points
- By utilizing data generated through your Google Ad Manager (GAM) account, you can learn a great deal about your ad performance. This includes when your fill rate drops below your normal or desired frequency.
- There are several factors that can impact fill rate, including the type of ad format being used, ad viewability, and economic conditions.
- Understanding these factors and how they might affect your fill rate can help you figure out the root cause and come up with the best solution for your website. Or, you can choose to work with a partner, like Playwire, who has a team of yield ops and tech experts ready to assist the moment you see a drop.
Having a low fill rate is like hosting a dinner party where hardly anyone shows up. You send out fancy invitations, spend hours preparing an entire meal but only two of your friends actually accept the invitation. Ad fill rate is essentially the number of people who actually saw your beautiful spread compared to the total number of people you invited.
When you have a higher fill rate, in the simplest terms, it means that your available ad inventory is being filled with ads. On the flip side, when you have a lower fill rate, it means that your ad requests are not returning ads, which has ultimately left available ad impressions unfilled. This can cause serious harm to your ad revenue.
Troubleshooting low fill rate, like anything in ad tech, can be difficult. You have to start by identifying the root cause and often will need to do a bit of testing to identify and fix the issue.
To help get you started, and ensure all your hard work does not go unnoticed by advertisers, check out our step-by-step guide to troubleshooting low fill rate all on your own.
Fill Rate Basics
Before we jump into solving, it is important to make sure you understand some of the basics about fill rate. If you already know the basics, feel free to keep moving past this section.
To understand more about fill rate, let’s talk supply and demand. You’re likely familiar with diamonds, but do you know what makes them so valuable? It is the fact that they are so rare. They are in high demand because there is a low supply.
The more rare an item is, the higher the price people are willing to pay for it. The more common an item is, the lower the price a person is willing to pay. Publisher ad inventory is no different. Make too much, each unit becomes less valuable. Limit the inventory, individual unit price will soar.
Supply and demand create a very delicate interplay in how they influence your total ad revenue. Increase your supply (or, the volume of ads) and the demand for that supply will go down (meaning, your CPMs).
You want the perfect balance between that supply and demand to maximize top-line revenue. Increasing the sheer number of ads shown increases your supply.
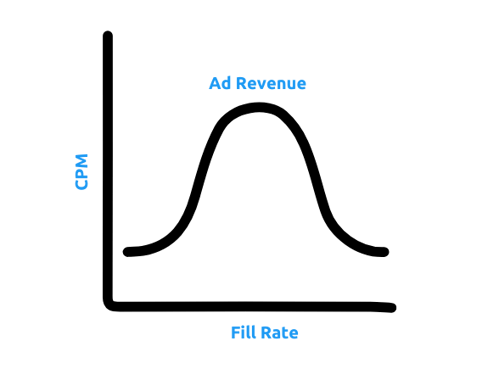
At the end of the day, to keep your inventory “valuable,” you’ll actually never want a 100% fill rate. It means, at some level, you are probably undervaluing your inventory and actually hurting your ad revenue (crazy to think, I know!)
What is “Low” for Fill Rate?
Now that you know about the delicate balancing act that fill rate participates in, let’s define what you’d consider a “low” value for fill rate in the first place.
As you’ll learn more about below, the geographical mix of your traffic will heavily influence your fill rate. The benchmarks discussed here are based on a geographic mix of at least 50% US-based traffic, so keep that in mind as you look at these benchmarks.
If you’re looking for a benchmark to aim for, an ideal “best-case-scenario” type of fill rate is between 75% - 85% on the high end. If you’re above 75% you’re golden, but if you’re above 90% you might be squeezing too hard and could improve your revenue by implementing a smart price flooring strategy.
If your fill rate is between 50-75%, you could probably look for optimizations to bring it up. In this instance, you’ll carefully want to look at your revenue as you do it. You might find that you actually find your revenue sweet spot somewhere in this fill rate range, meaning that your revenue may go down as you try to keep improving your fill rate.
If your fill rate is between 25-50%, you should be prepared to work hard on identifying why and optimizing to get it over 50%.
If your fill rate is below 25%, something pretty big is probably broken.
-- Article Continues Below --

Identifying the Root Cause of Low Fill Rate
Harnessing the power of your data within Google Ad Manager can be the ultimate weapon in your fight against low fill rate. GAM can reveal invaluable insight into your ad performance. You just may have to dig a little bit to get to the good stuff.
So, take a deep breath, open up your GAM account, and let's navigate this journey to higher fill rates one step at a time.
First things first, you need to actually run a report on fill rate in order to have the proper metrics to dive into. Complete the steps below to run a report on fill rate inside GAM:
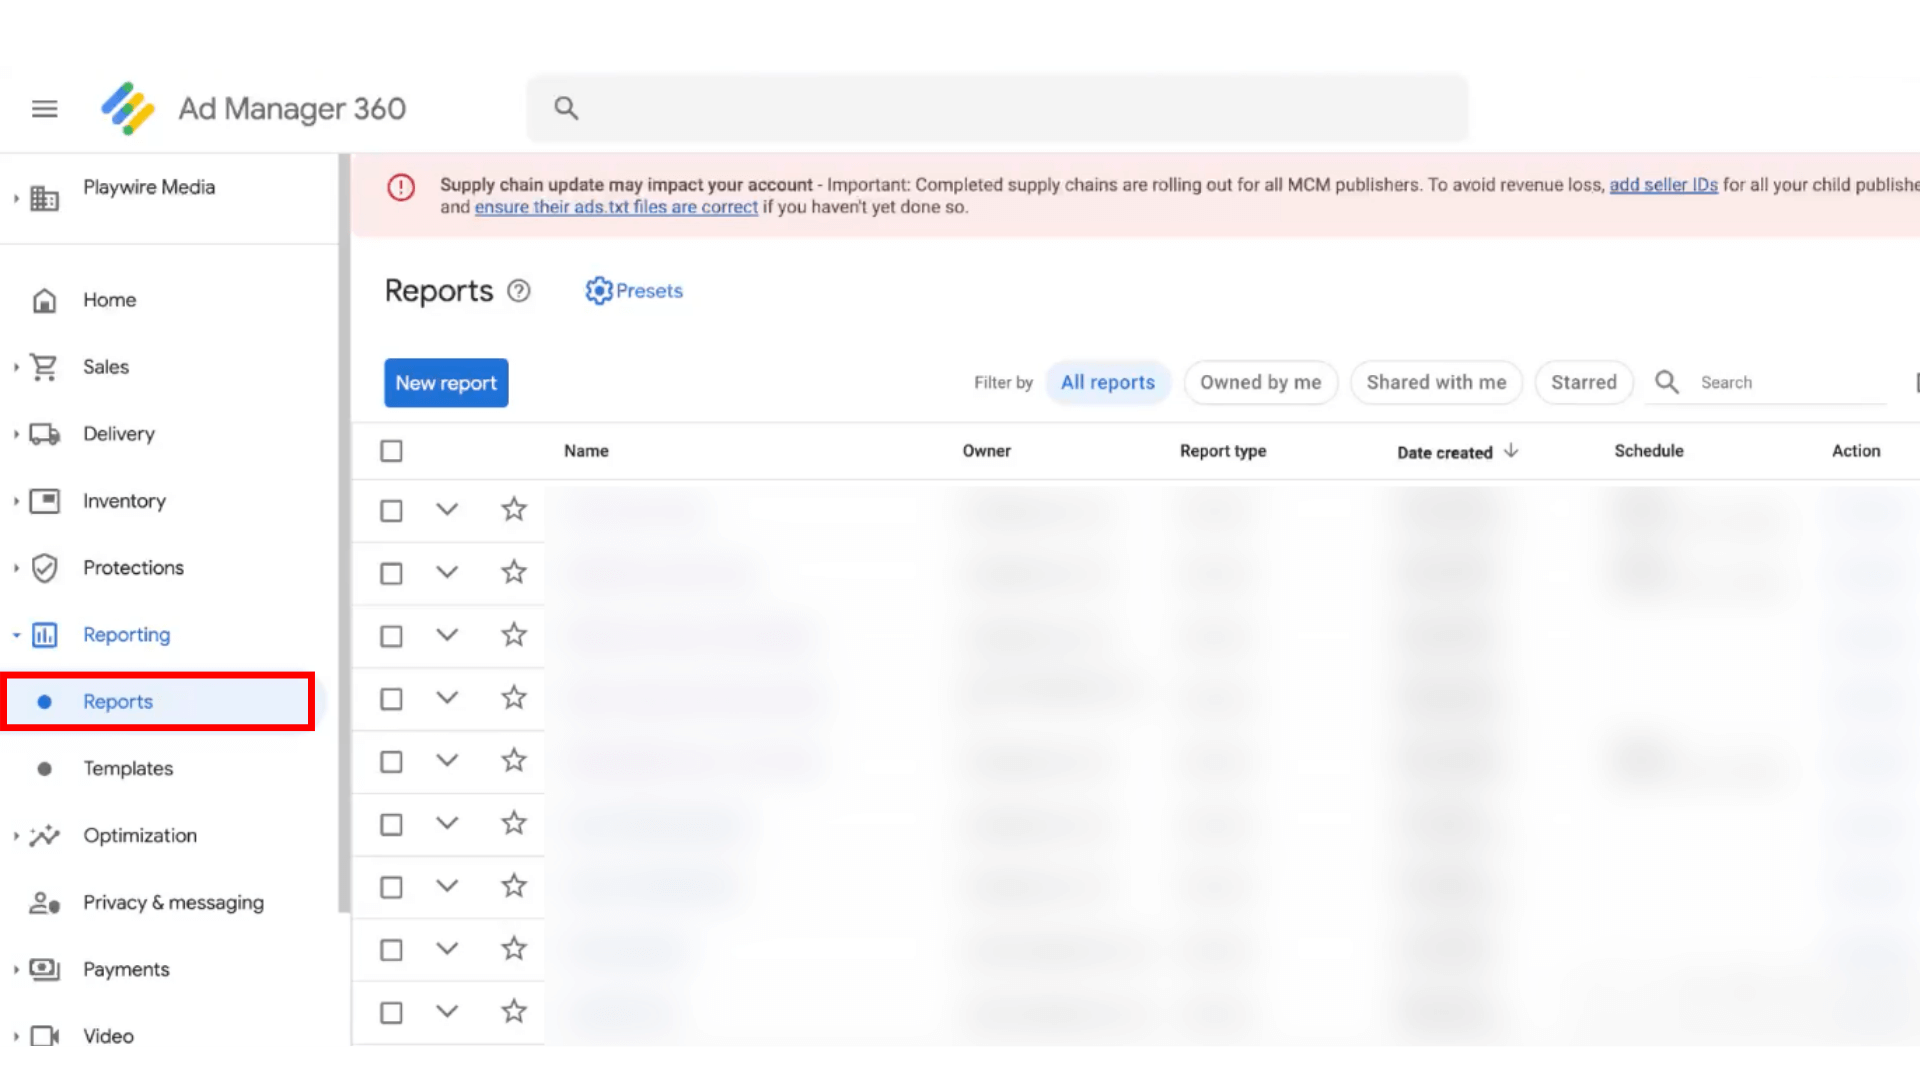
1. Start by opening GAM and click Reports on the left side of your screen.
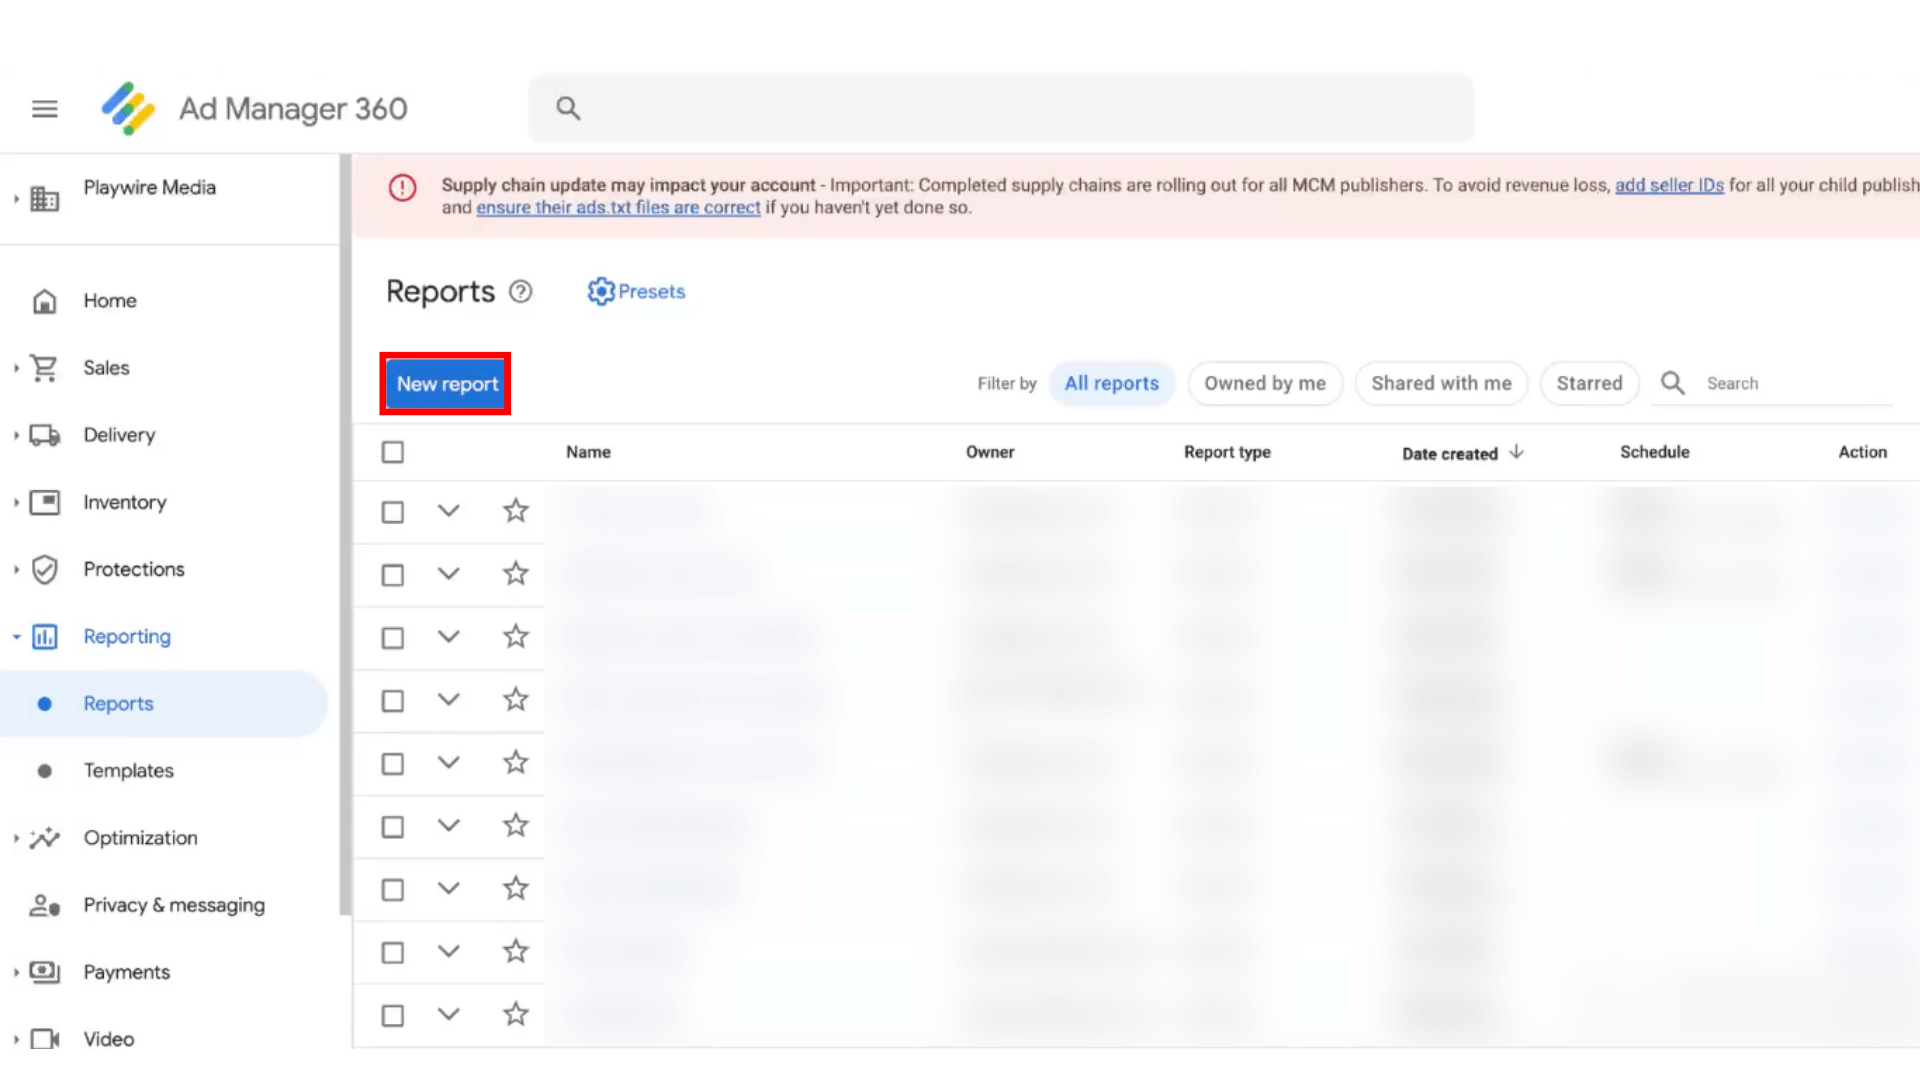
 2. Click New Report.
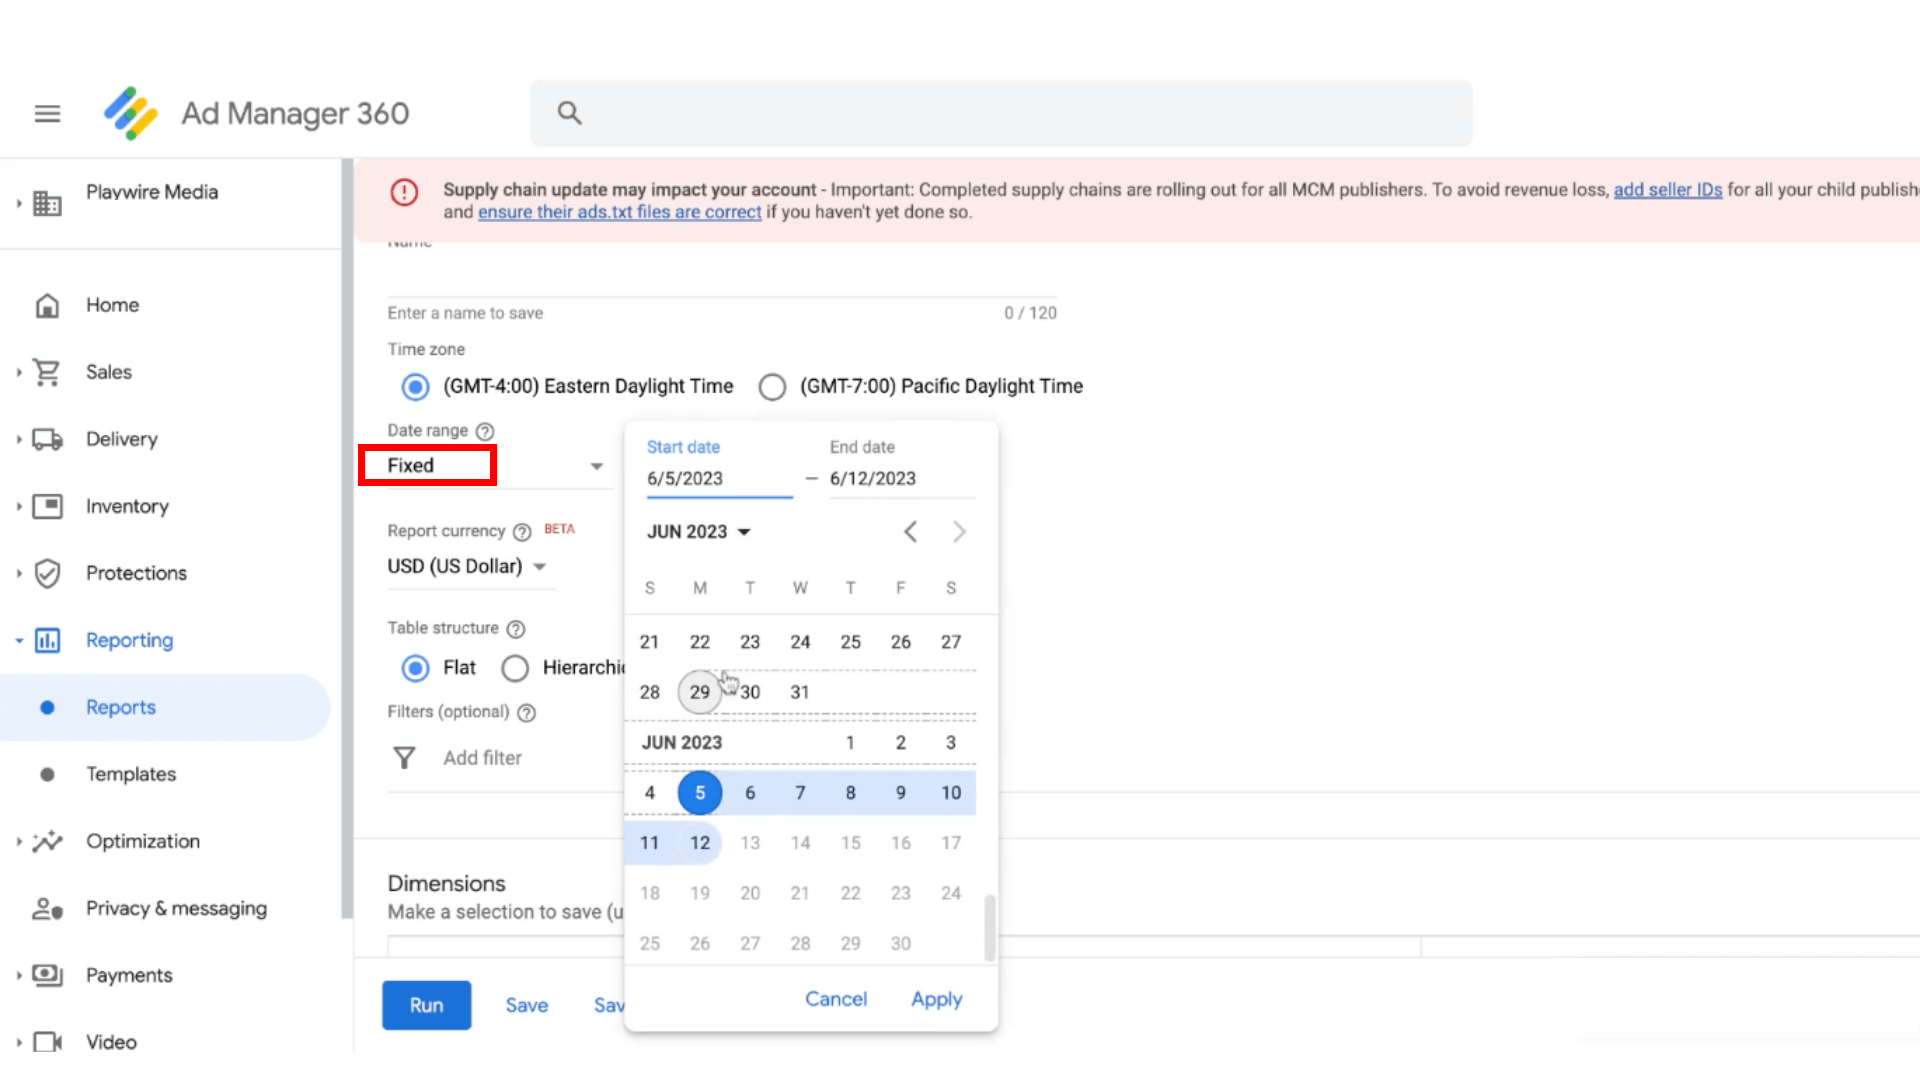
3. Scroll down to Time Zone. There, with the Dynamic date range selected, you can click last 7 days, last 30 days, etc.
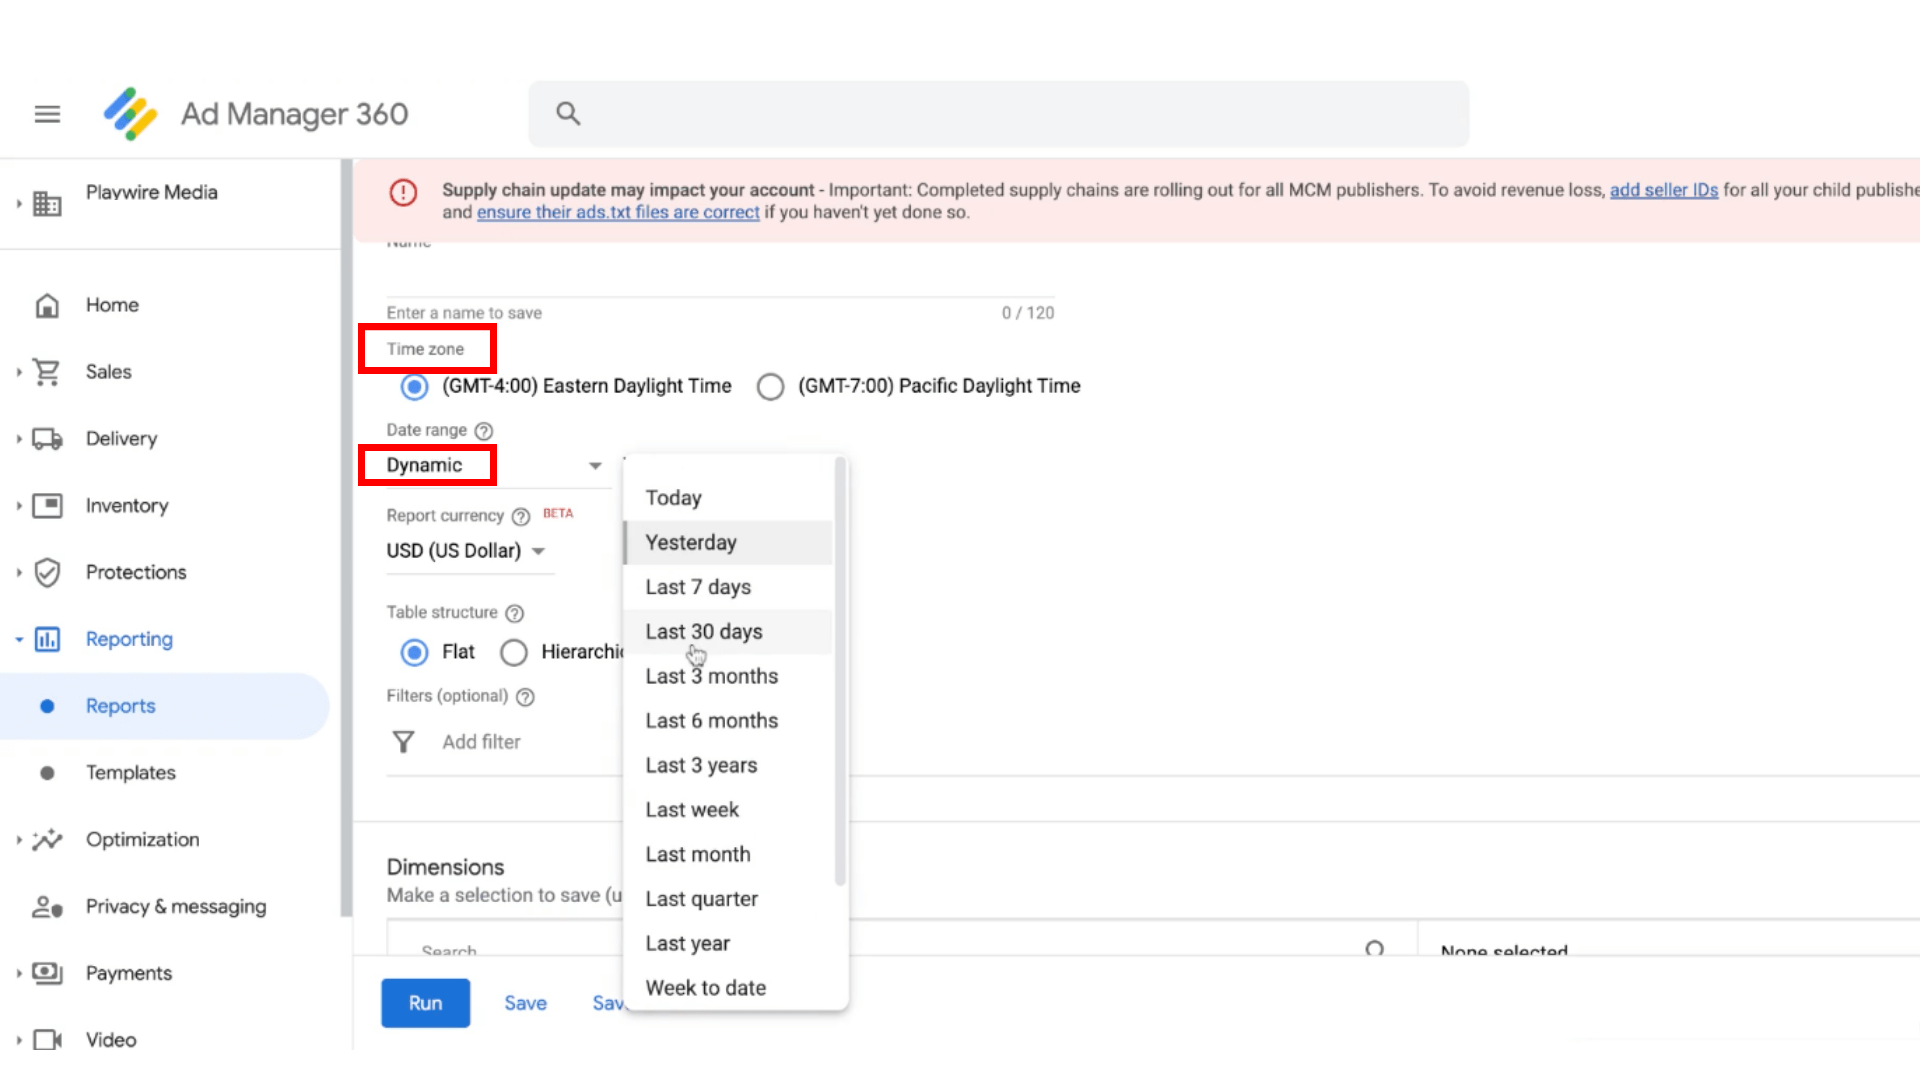
4. Or, if you need a specific time frame, you can click the Date Range drop-down menu and click Fixed and input your specific time frame there.
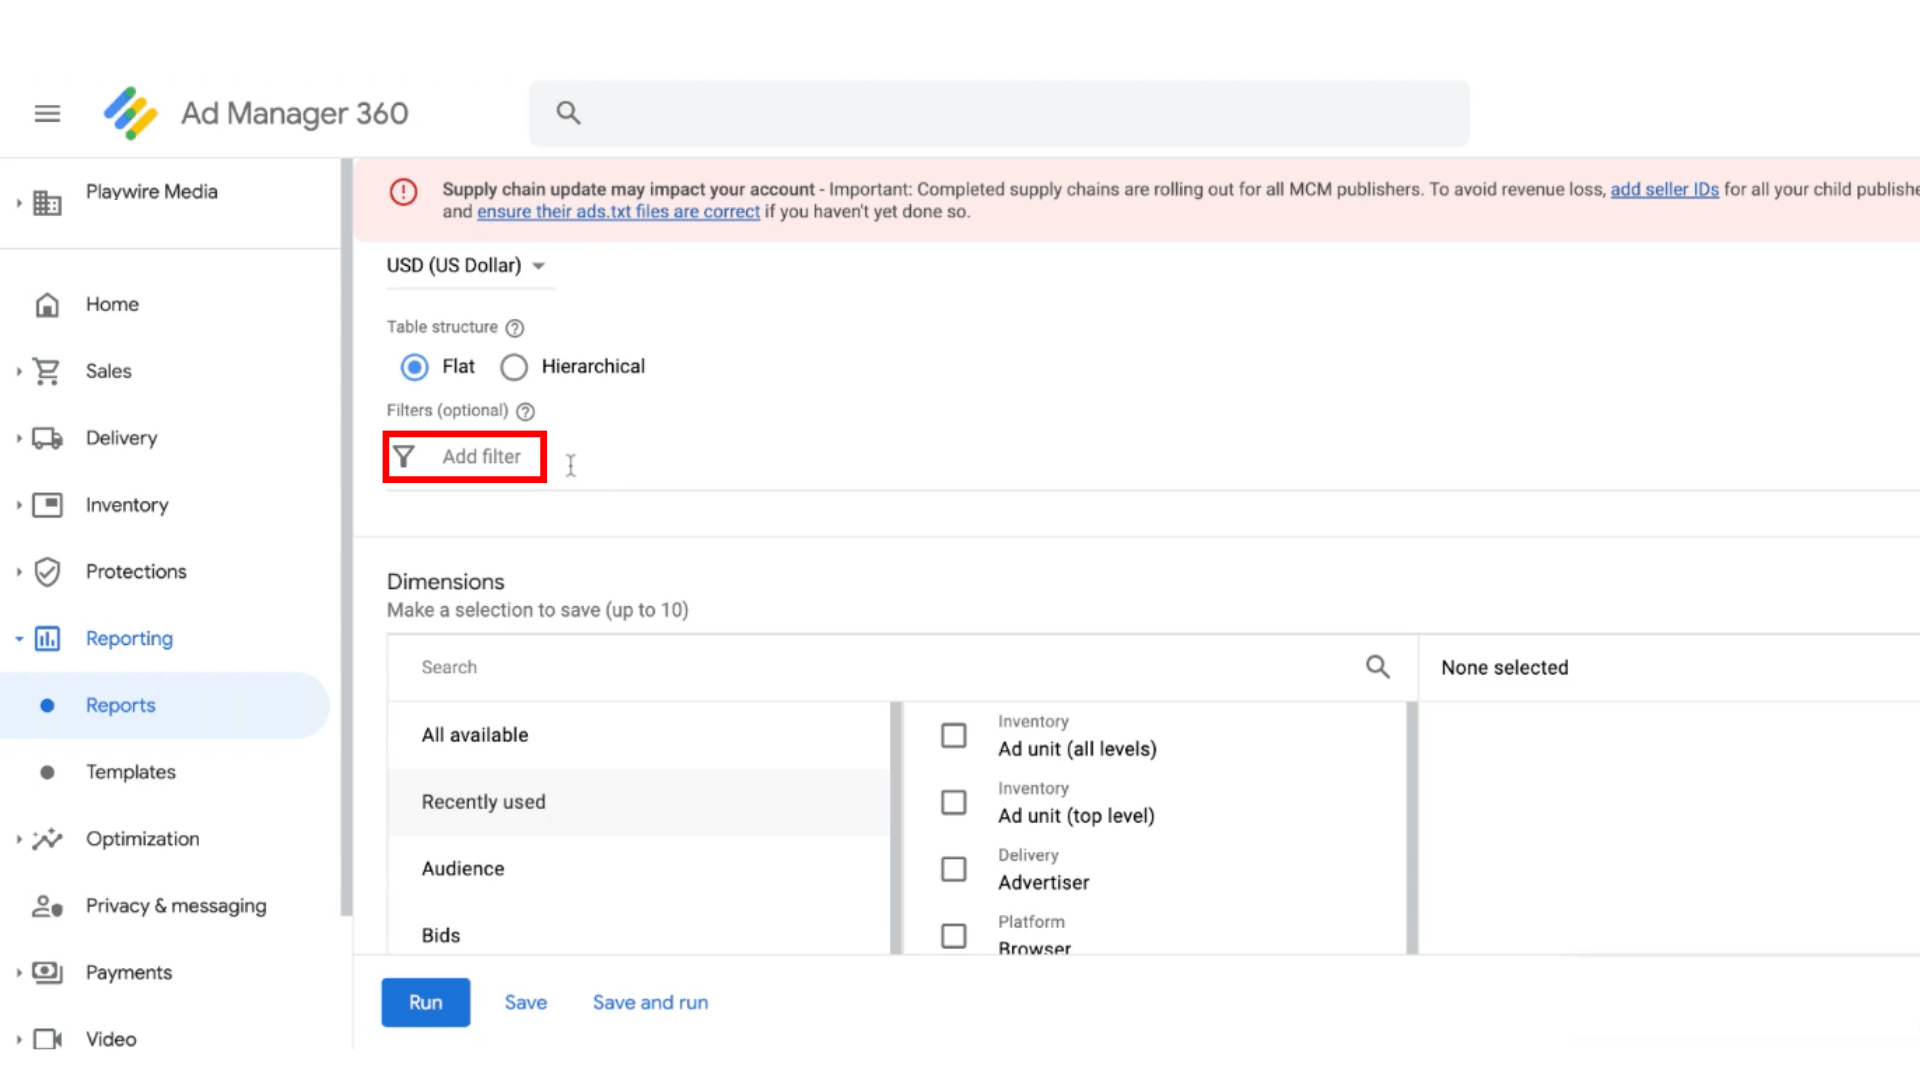
5. Once you've selected your date range, scroll down to Add Filter.
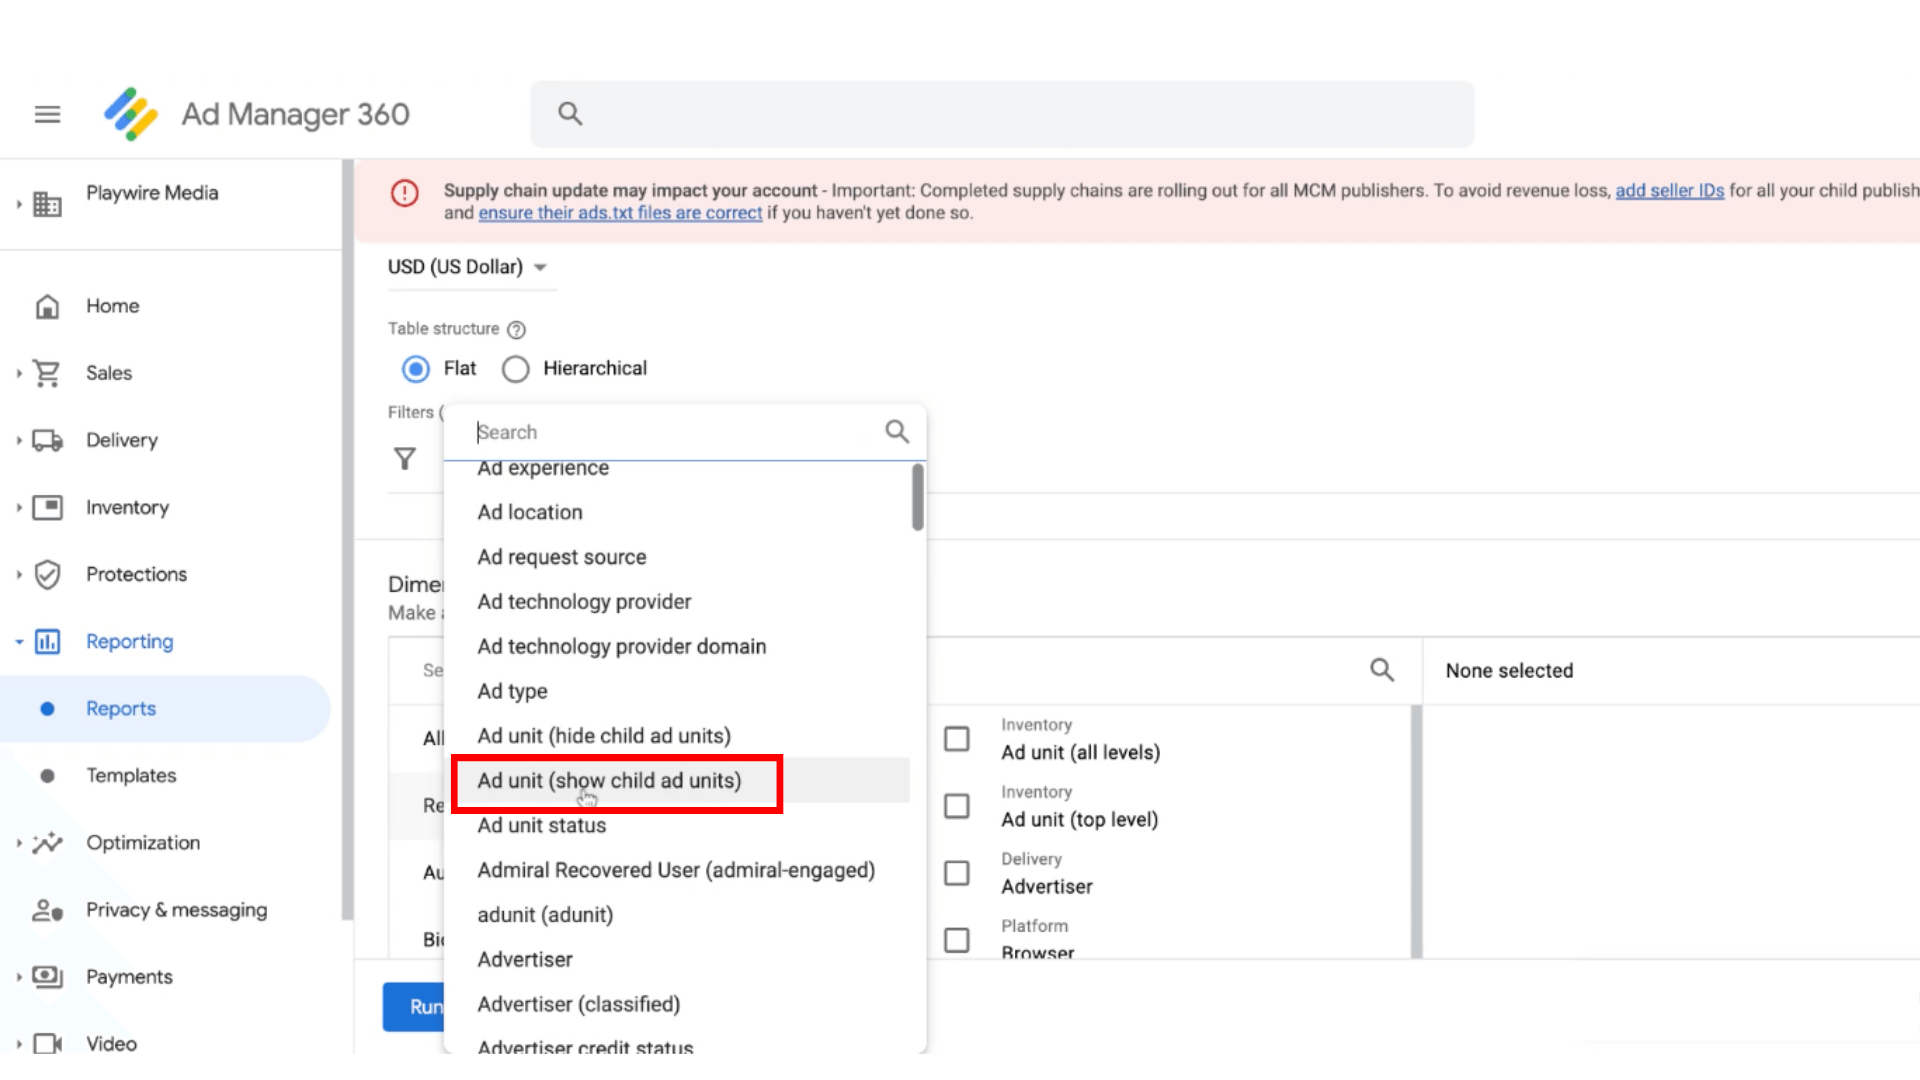
6. Click Ad unit (show child ad units).
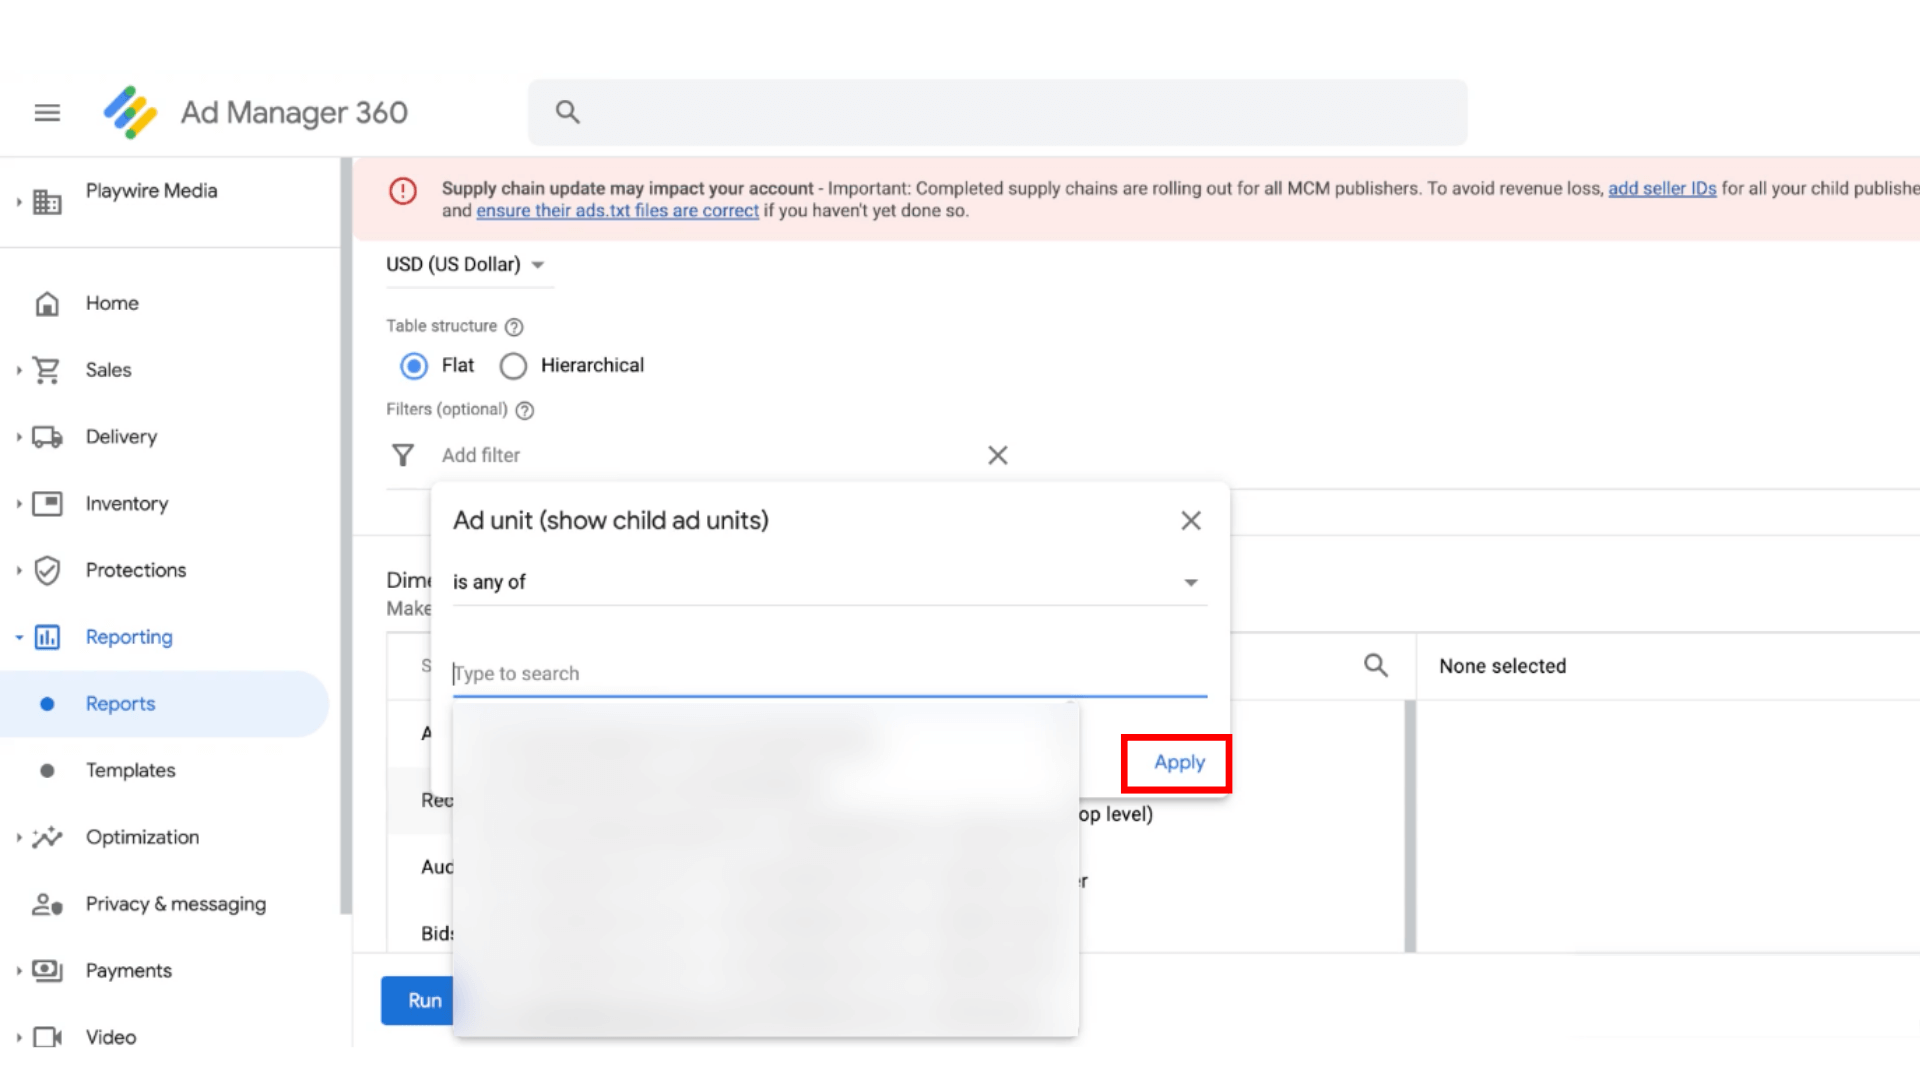
7. Type in the name of the site you’d like to pull, select it, and click Apply.
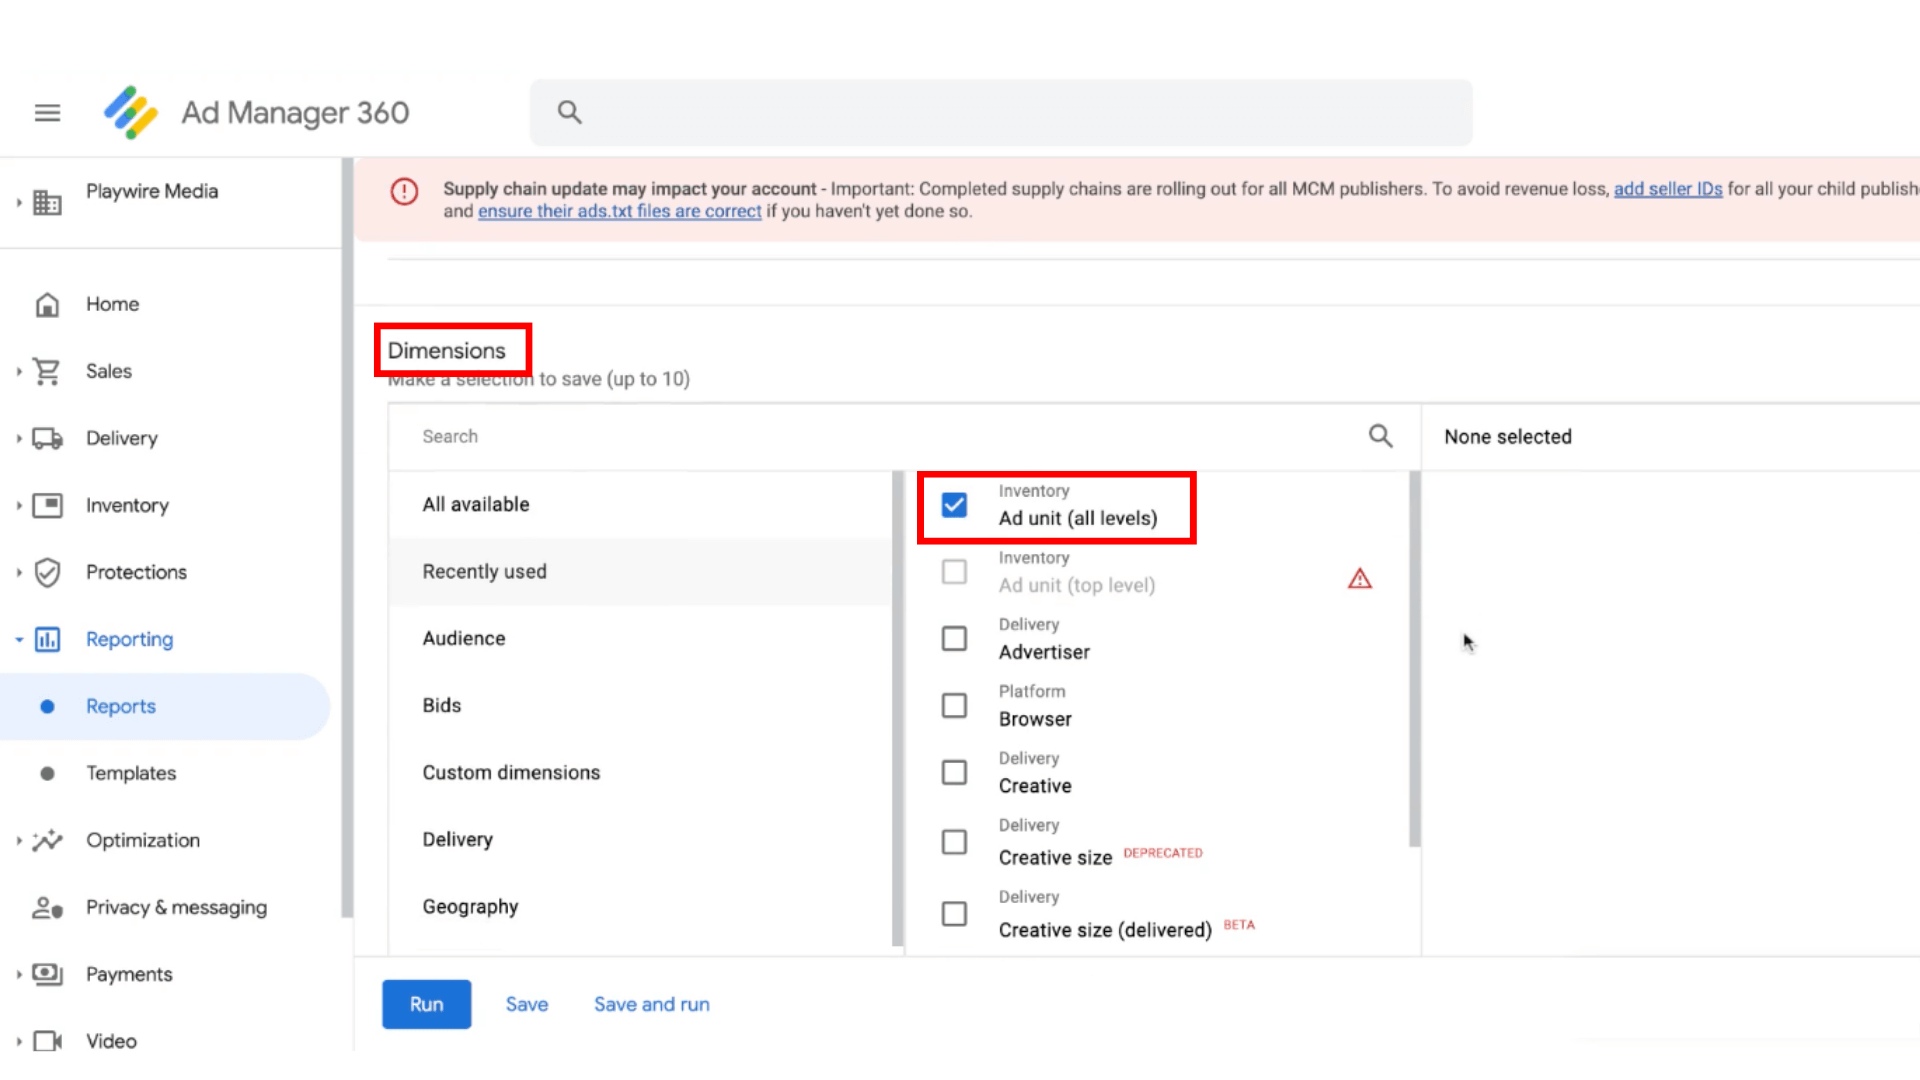
8. Next, scroll down to the Dimensions section below.
9. Select the dimension you want depending on if you want it broken down by date, by the time frame you selected earlier, etc. For our example, we selected Ad unit as our dimension.
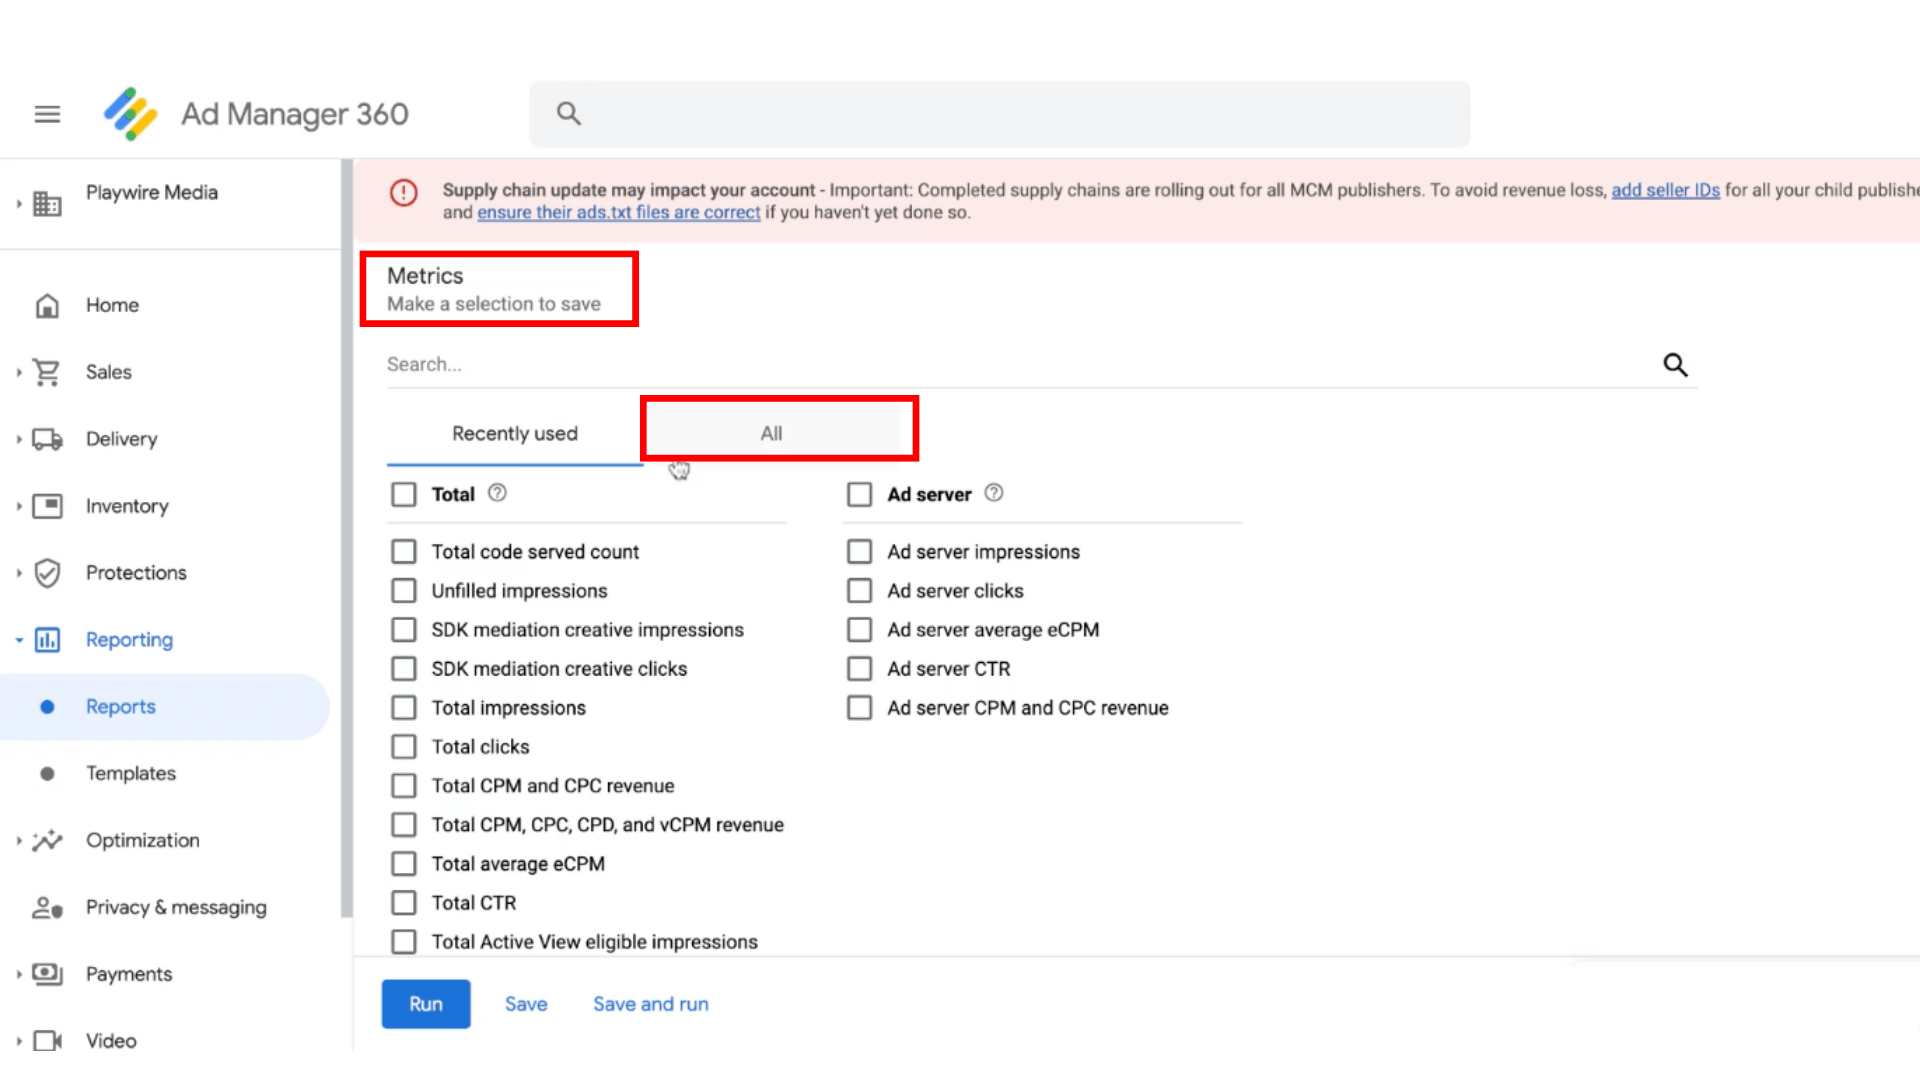
10. Once you’ve selected your dimensions, scroll down to the Metrics section below and click All.
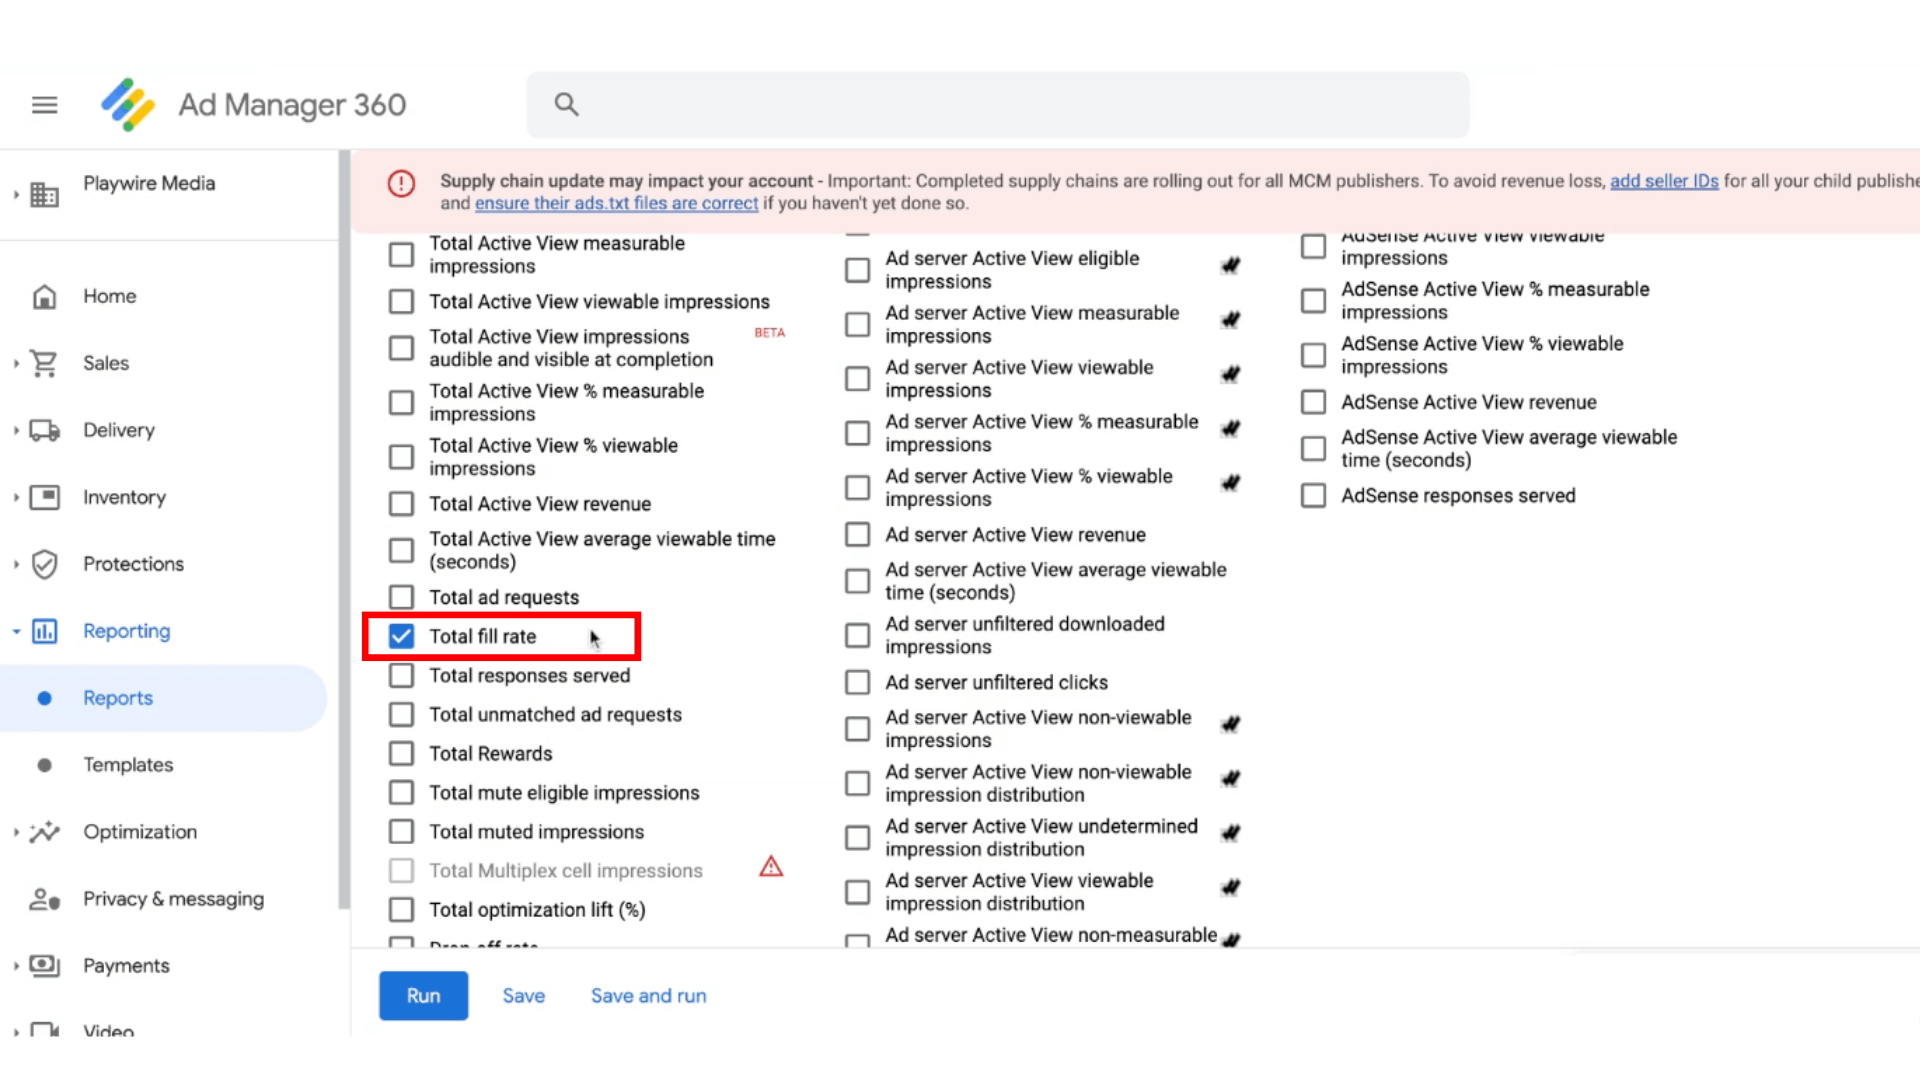
11. Click Total Fill Rate.
Note: If you’re going to be pivoting this data in Excel, we suggest clicking Total Impressions and Total Ad Requests as well.
As a reminder, the calculation for fill rate in Excel is impressions/ad requests.
12. Once you’ve selected your metrics, click Run.
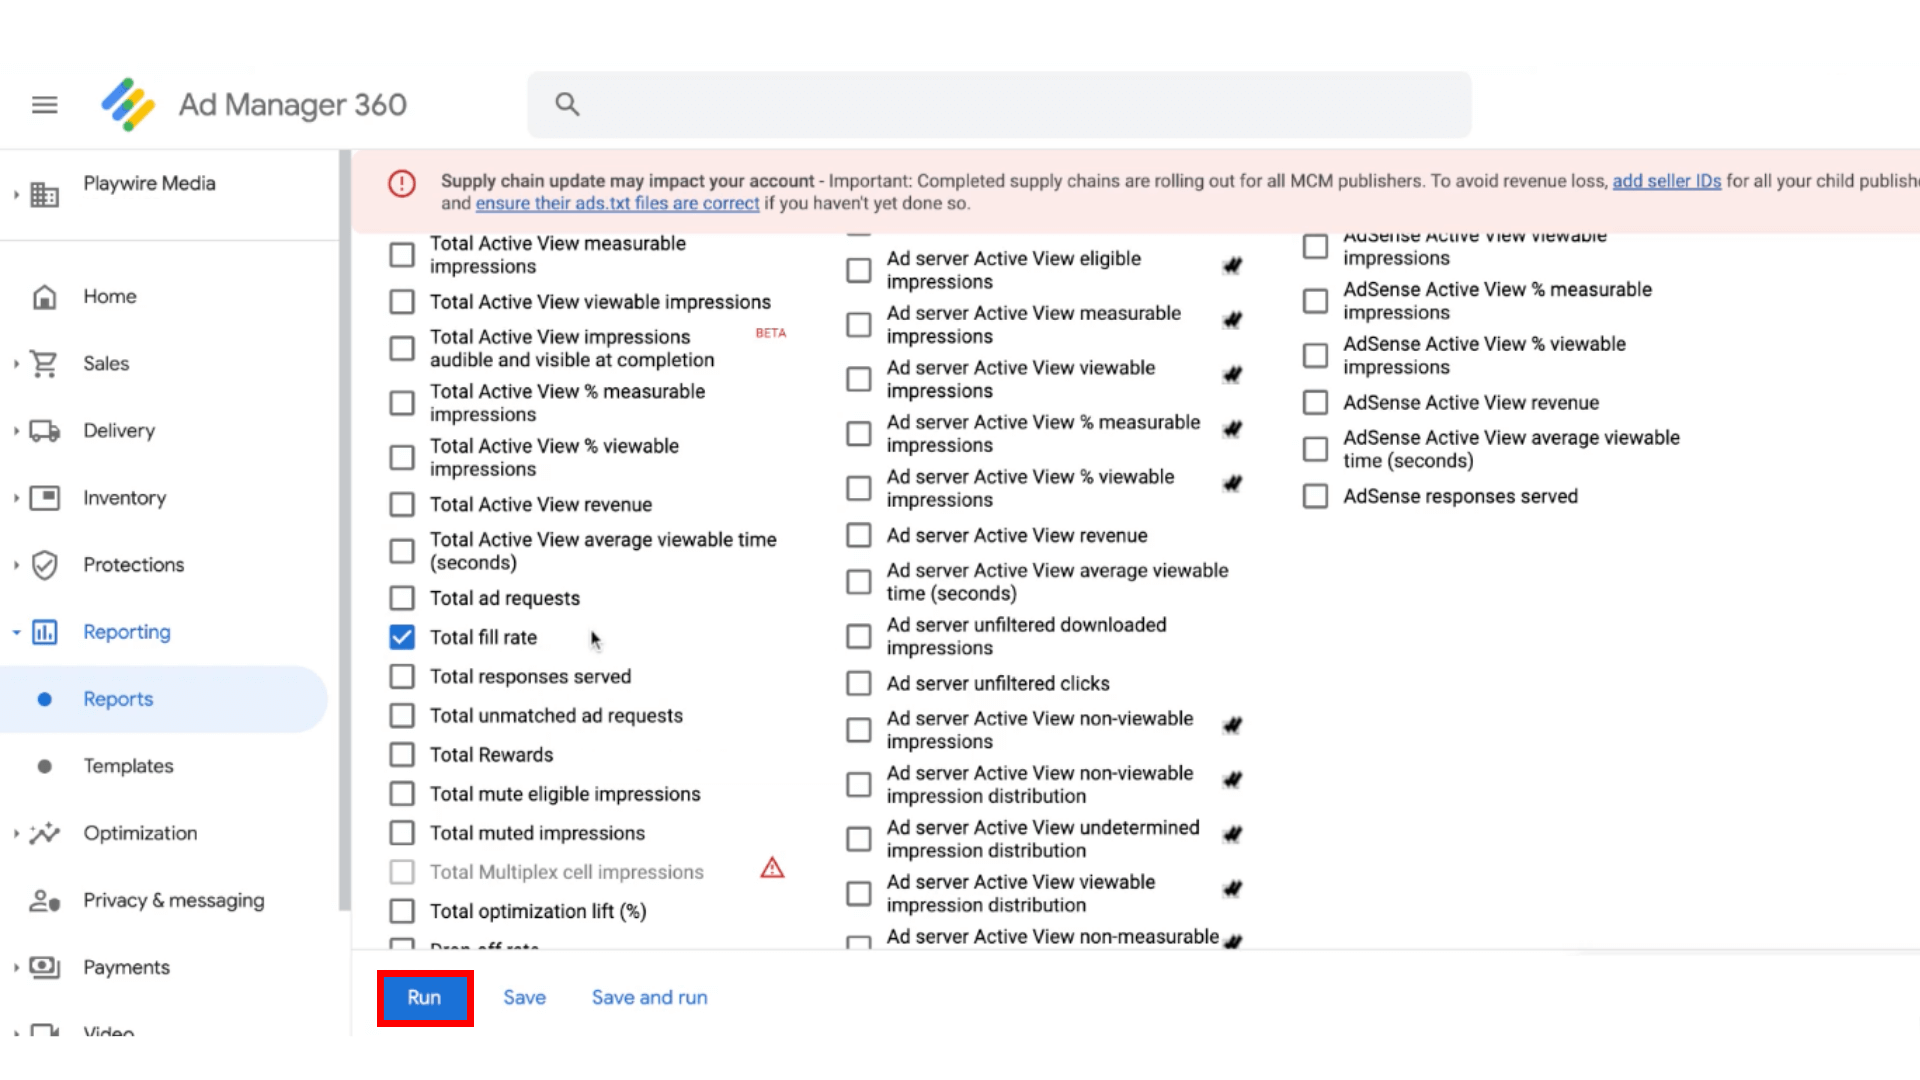
13. Now, in GAM, you can see the total fill rate for the selected time frame for each ad unit.
%20(1).png?width=708&height=398&name=LFR%2013%20(New)%20(1).png)
Now that you have your report in front of you, here are 4 steps to take in order to identify the root cause of your low fill rate:
Determine if the low fill rate issue is across all ad units or only specific ad units.
Identifying whether the low fill rate issue is across all ad units or specific ad units is a good place to start. If it's across all ad units it may be necessary to adjust your overall ad monetization strategy. But if it's only with specific ad units, it may be better to evaluate the placement of those units.
Determine which device the low fill rate issue is correlated with.
Different devices can have different fill rates. So whether it's desktop, tablet, mobile, or all of them, be sure to check fill rates per device.
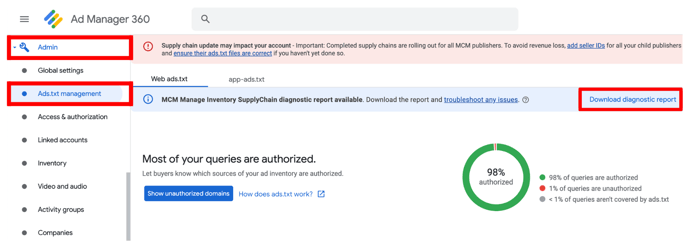
Check your ads.txt to confirm it has been installed correctly.
A missing ads.txt (and/or app-ads.txt) file and/or broken Supply Chain (SChain for short) will contribute heavily to low fill rates.
You can check your ads.txt, by completing the following steps:
Make sure you have your ads.txt up, and then check the ads.txt reporting in GAM to confirm it's being crawled and is authorized.
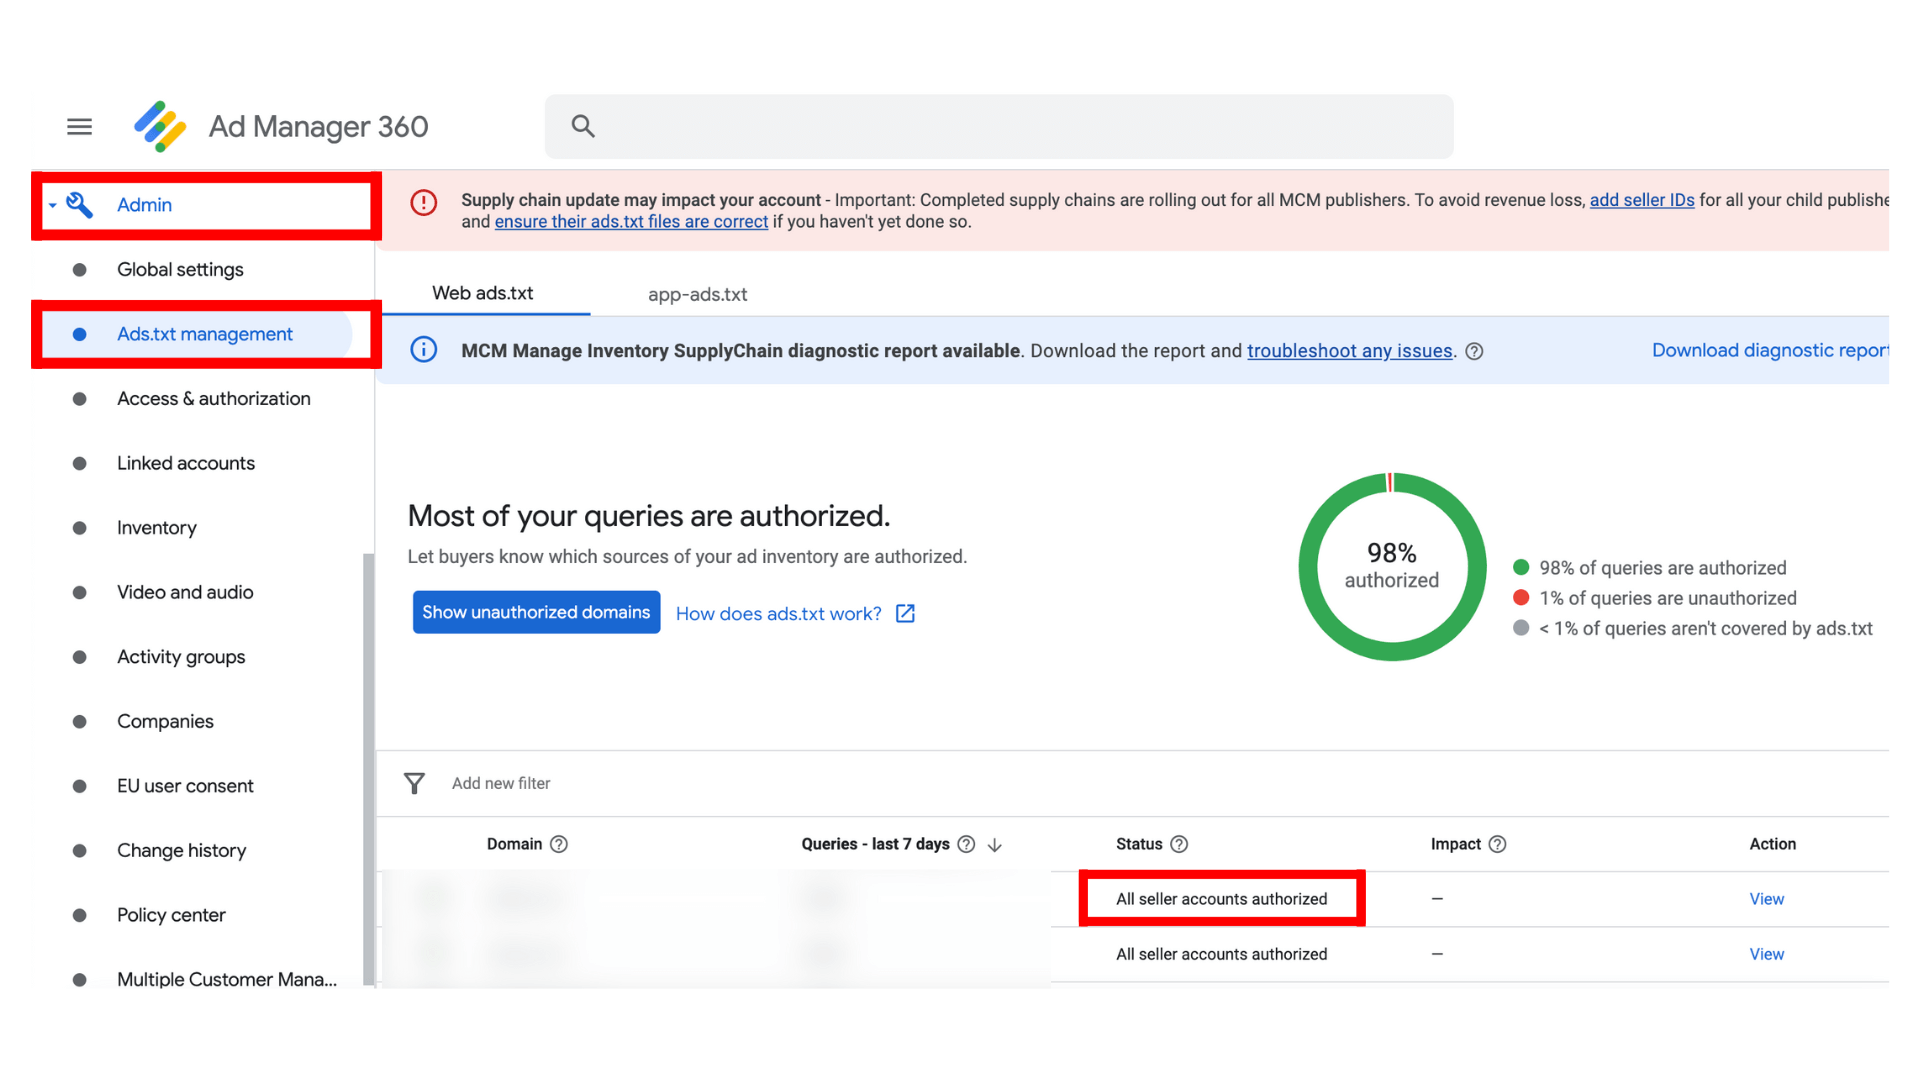
Check that SChain is authorized.
If your ads.txt file is not installed correctly, reinstall the file and check GAM to confirm that the file is installed correctly.
If the ads.txt file was installed correctly, proceed to step 4 for further troubleshooting.
Check your website to determine if the ads are displaying as expected.
If ad units are not displaying, there may be a div unintentionally hidden. If all ad units are displaying properly, reference the chart below to identify the cause site-wide or per unit.
-- Article Continues Below --

Learn more about creating and managing ads.txt files with our Ads.txt Resource Center.
Cracking the Code: Investigating the Root Cause of Your Low Fill Rate
So, you’ve followed steps 1-4 and you’re still not finding anything. Don’t worry, there’s plenty more you can check. If you haven't found the culprit to your low fill rate yet, this chart is sure to help you crack the code.
Check | Steps to Investigate | Potential Causes of This Issue |
Ad format | Review the ad formats that are active on your site. | Different ad formats (such as display ads, video ads, native ads, etc.) can have different fill rates based on demand and competition. |
Ad viewability | Are your ads fully in view or obstructed by other elements on the page? | Ads that are not fully in view or obscured by other page elements may have lower engagement and click-through rates, resulting in lower fill rates. |
Competition - Demand Stack | If you have header bidding set up, have any bidders stopped spending entirely or severely decreased their spending? | The number of bidders and competition for ad inventory can affect your fill rates. Higher bid density will result in higher fill rates. |
Economic conditions | What are the current economic conditions? | Economic conditions, such as a recession or market downturn, can impact advertiser spending and demand for ad inventory, which can impact fill rates. Keep a weather eye on how economics are affecting ad revenue with our Publisher Earnings Index. |
Geographical Breakout | Has the Geographical breakout recently changed? Is the breakout from regions that are less attractive to advertisers? | A site's traffic geography breakout can impact its overall fill rate, as advertisers may be more interested in targeting certain regions than others. For example, if your site has a majority of traffic from a region that is less attractive to advertisers, it may result in lower fill rates compared to a site with traffic from more attractive regions. |
Google policy violations | Has your site been flagged with a Google policy violation? | If your site is flagged for a policy violation, Google will begin restricting ad serving or disabling ads serving altogether depending on the severity of the violation. Go to Admin > Policy Center in GAM to check for policy violations. |
Invalid Traffic (IVT) | Was there a recent spike in traffic on your site that may be identified as IVT? | A sudden increase in IVT traffic may result in advertisers reduced or halted spending, which affects fill rate. |
Price Floors | Are your price floor settings too high? | Price floors can impact fill rates, as they can limit the number of advertisers who are willing to bid on the ad inventory. If the price floor is set too high, it could price advertisers out and result in lower fill rates. |
Refresh Settings | Were there recent changes to the refresh setting of the ad unit(s)? | If so, the changes could easily alter your ad request volume, thus affecting fill. Changes in the refresh settings of an ad unit that increase ad requests could negatively affect fill rate. |
Side speed | Is your site speed slow or has it recently appeared slower? You can check your site’s speed here. | Slow-loading sites may have lower user engagement and retention, which can lead to lower fill rates over time. Get guidance on improving site speed with our page speed tip series. |
Time Frame | What is the time period of the fill rate drop? What is the typical fill rate for the day of the week, month, and year? Was the drop sudden (Example: 80% to 60% in a short timeframe) | Potential causes:
|
Time on Page | Has your time on page data increased recently? | The longer a user spends on a page, the less valuable ad requests and impressions become, which ultimately can decrease fill rate. |
Type of device | Review fill rates per device to see if there are any drastic differences. | Different devices, such as desktop, tablet, and mobile, may have different fill rates. Narrowing a drop in fill rate to a particular device can help you more understand where to look next. |
User engagement | Has your user engagement recently decreased? | If users are not engaging with the ads on your site, fill rates may decrease. |
Allow Playwire to Take Your Website’s Fill Rate to New Heights
As you can see, there is an endless quantity of factors you need to monitor in reference to just your ad fill rate alone. And doing so can take a lot of time and technical know-how.
Think of us like the cool kids, we have the experience and resources to get even the most popular kids in school to attend your party.
We’ve built a team with both the depth and breadth of expertise needed to both diagnose and fix any problem we come across including low fill rate.
Our Yield Ops team keeps a close watch on your ad performance, ensuring no dip in fill rate goes unnoticed and that your revenue is always protected.
And, if that isn’t enough, our team of tech experts is constantly working in concert with our AI and machine learning algorithms to find unique opportunities to optimize and increase your revenue.
Apply now to chat with a Playwire team member.
