Most ad-supported publishers treat Google Search Console like a smoke detector: they install it, forget it, and only look up when something is already on fire. That's a mistake, and an expensive one.
Your ad revenue is a function of pageviews. Your pageviews are a function of how well Google can find, index, and surface your content. GSC is the only tool that shows you that entire chain using real data straight from the source, not a third-party's best guess.
This guide covers every major feature of GSC, framed specifically for publishers who care about organic traffic because organic traffic pays the bills.
Don't have time to read this?
Take a copy with you
Select Your Chapter
Google Search Console is a free platform from Google that lets site owners monitor and troubleshoot how their site appears in Google Search results. It provides data on search performance, uncovers technical errors, and gives publishers direct visibility into how Google crawls and indexes their content. For a deeper orientation to the tool itself, see our complete guide to what Google Search Console is and how it works for web publishers.
That's the standard definition. Here's what it actually means for an ad-supported publisher.
GSC sits one layer upstream of your revenue metrics. Your yield reports tell you how well you monetized the traffic you got. GSC tells you whether that traffic was ever going to arrive. Every metric in the tool is a leading indicator for a downstream revenue outcome, and that's exactly how you should read it.
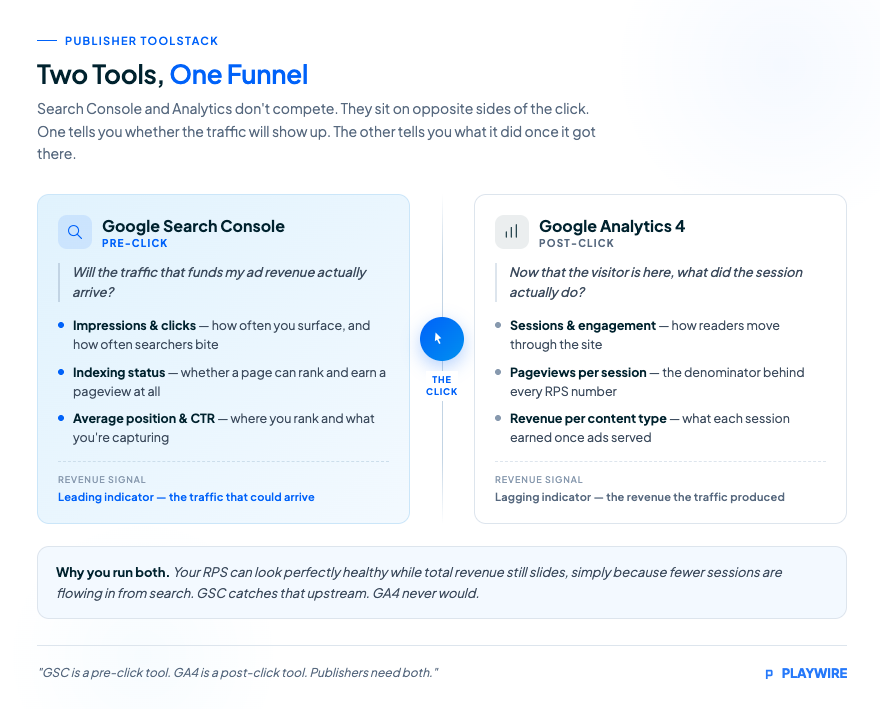
Publishers use both tools, but they answer completely different questions. The confusion about which does what is common enough that it's worth a clean comparison before you build any workflow around either.
Dimension | Google Search Console | Google Analytics 4 |
|---|---|---|
What it measures | Search visibility, crawling, indexing, rankings | On-site user behavior, sessions, conversions, engagement |
Where in the funnel | Pre-click (before the visitor arrives) | Post-click (after the visitor lands) |
Primary data source | Google's own search index | Your site's tracking code |
Key publisher use case | Are my pages indexed? Are my rankings holding? | How are sessions monetizing? What's my RPS by content type? |
Revenue relevance | Leading indicator: traffic that could arrive | Lagging indicator: revenue the traffic produced |
The two tools are designed to be used together, not instead of each other. Integrating GSC with Google Analytics 4 offers a complete view of the user journey, from keyword impression to on-site behavior. That integration bridges the gap between the search-visibility layer GSC owns and the on-site engagement layer that determines how many ad impressions each session actually produces.
Before any of the diagnostic capability matters, your property needs to be configured correctly. A misconfigured property returns incomplete data, and incomplete data leads to wrong decisions. Our step-by-step Google Search Console setup guide for publishers walks through the full configuration process if you're starting from scratch.
Start at search.google.com/search-console and add your site as a property. GSC offers two property types: domain properties and URL-prefix properties.
Property Type | What It Covers | Best For |
|---|---|---|
Domain Property | All URLs across all subdomains and protocols (HTTP, HTTPS, www, non-www) | Most publishers. Captures your full footprint |
URL-Prefix Property | Only URLs beginning with the exact prefix you enter | Subdirectory-specific tracking or legacy setups |
Domain properties are the right choice for nearly every publisher. They consolidate all your traffic data in one view so you're never accidentally missing a subdomain in your reporting.
Once you've added your property, verify ownership. The DNS TXT record method is the most reliable for domain properties. Add a short verification string to your domain's DNS settings, and Google confirms ownership within minutes to a few hours.
After verification, submit your XML sitemap. This is not optional. Your sitemap tells Google what you want indexed, at what priority, and when it was last updated. Submit it via the Sitemaps report in the left navigation. Publishers with large archives or multiple content types should submit separate sitemaps for articles, video, and images where applicable.
The branded vs. non-branded query filter, one of the most useful segmentation tools added in 2025, is only available for top-level domain properties. If that segmentation matters to your reporting, and it should, set up a domain property from the start.
The Performance report is where most publishers spend their time, and for good reason. It shows clicks, impressions, CTR, and average position, with data filterable by query, page, country, device, or date range up to 16 months. For a full breakdown of what each report section does, see our feature-by-feature breakdown of what Google Search Console does.
The trick is reading it like a revenue forecast, not a scoreboard.
These four metrics sit at the top of every Performance report view. Here's how each one translates for an ad-supported publisher:
GSC Metric | What It Measures | Revenue Relevance |
|---|---|---|
Impressions | How often your pages appeared in search results | The upstream signal for future pageview volume. Rising impressions forecast more monetizable sessions |
Clicks | How often searchers actually visited | The closest GSC proxy for pageviews your ad stack will fill |
CTR | Clicks divided by impressions | Reveals whether you're capturing the traffic you're eligible for |
Average Position | Where you typically rank for a query | Higher positions drive more clicks; position drops are early warnings of traffic loss |
Impressions are your demand signal. When they climb on non-branded queries, new readers are discovering your content and a wave of monetizable pageviews is likely on the way. When they fall, you have advance warning of a coming traffic dip, often before it shows up in your ad server.
CTR is where you find money you're already eligible for but not collecting. In the Performance report's Queries list, a high impression count with a low CTR usually points to a mismatch between your title or meta description and what the searcher expects to find, and fixing that mismatch is often the fastest way to turn existing visibility into actual traffic. For a publisher, closing that gap is free inventory. You already ranked. You just weren't converting the impression into a session.
The date comparison feature is one of the most underused tools in the Performance report. Use it to see seasonal trends or the impact of Google updates on your traffic. Run it week over week, month over month, and period over period versus the prior year.
This is the same discipline serious yield teams apply to pageview RPS. If your RPS drops on a Tuesday and your GSC impressions dropped the prior Thursday, you've just traced a revenue problem back to its actual cause in under five minutes.
One critical data limitation to plan around: Google Search Console operates on a rolling 16-month window for performance data covering clicks, impressions, CTR, average position, queries, pages, countries, and devices. If you want year-over-year data extending beyond that window, export and warehouse it yourself. Once it ages out, it's gone.
The fastest traffic wins in GSC come from pages that are close to ranking but haven't broken through yet. Cross-reference average position with CTR to find quick wins, specifically positions 5 to 15 with solid volume. A page sitting at position 8 on a high-volume query is one optimization pass away from page-one real estate, and page-one positions drive dramatically more clicks.
For portfolio publishers managing dozens of sites, this is a repeatable, scalable optimization loop. GSC points at the exact URLs where a modest ranking gain translates directly into monetizable traffic. Our guide on how to use Google Search Console to improve SEO on your publishing site goes deeper on turning these signals into a systematic optimization process.
The Performance report tells you how visible your indexed pages are. The Page Indexing report tells you whether your pages made it into the index at all.
The Page Indexing report shows which pages Google has discovered, crawled, and indexed. A page that isn't indexed cannot rank, cannot earn a pageview, and cannot serve a single ad. For publishers pushing out content daily, this is your production-line quality check. When something looks wrong, our guide to diagnosing and fixing Google coverage issues walks through the resolution process step by step.
GSC segments unindexed pages into specific status reasons. The ones that matter most for publishers:
Every article stuck in "Discovered - currently not indexed" is content that cost you to produce and is earning you nothing. Don't treat this report as background noise.
The URL Inspection tool gives you a ground-level view of any single page on your site. It allows you to see any page on your site exactly as Google sees it, check whether Google can access and index it, and request indexing after important changes.
The request indexing function is particularly useful for publishers. When you publish a high-value piece of content, a trending story, a major evergreen guide, a page you've just significantly updated, use URL Inspection to nudge Google's crawlers toward it faster. For time-sensitive content especially, getting Google to index your site faster can mean the difference between catching a trend and missing it entirely. You won't always get a same-day crawl, but you'll consistently see faster pickup than leaving it to passive discovery.
URL Inspection also surfaces rendering issues. If your JavaScript-rendered content isn't appearing in Google's rendered view of the page, that's a ranking problem, and this tool will show you exactly what Google sees versus what your browser shows you.
Core Web Vitals aren't just an SEO concern. They're a direct revenue variable. Slow pages rank lower, earn fewer pageviews, and drive higher bounce rates, all of which compress the sessions your ad stack has to work with.
GSC's Core Web Vitals report grades your pages on three primary metrics, segmented by mobile and desktop:
Metric | What It Measures | Why Publishers Care |
|---|---|---|
Largest Contentful Paint (LCP) | How fast the main content loads | Slow LCP correlates with higher bounce rates, fewer ad impressions per session |
Interaction to Next Paint (INP) | How quickly the page responds to user input | Heavy ad loads and JavaScript from tag managers are common culprits |
Cumulative Layout Shift (CLS) | Whether page elements jump around as content loads | Ads that load after content is rendered are a primary source of CLS |
Publishers running complex ad stacks face a specific tension here: more ad units and heavier demand integrations increase INP and CLS scores. The Core Web Vitals report shows you where that tension is costing you rankings. Fix it there, and you'll see the benefit in both GSC position data and your session-level revenue metrics.
Google's threshold for "Good" LCP is under 2.5 seconds. INP target is under 200 milliseconds. CLS target is under 0.1. Pages in the "Needs Improvement" or "Poor" bands are ranking below their potential.
These two reports require immediate attention whenever they have data in them. A manual action means a human reviewer at Google has found a violation on your site and applied a ranking penalty. A security issue means Google has detected malware, hacking, or deceptive content.
Manual actions kill traffic fast and completely. The most common triggers for publishers include thin content at scale, unnatural links, hidden text, and cloaking. If you have a manual action, the Manual Actions report tells you exactly what triggered it. Fix the underlying issue, then submit a reconsideration request through the same report.
Security issues require urgent response. A compromised site loses rankings, triggers browser warnings, and can destroy advertiser confidence. Check this report weekly even if you're confident your site is clean, because attackers don't announce themselves.
The Links report in GSC shows your top linked pages, your top linking sites, and your anchor text distribution. For publishers, this report serves two functions.
First, it's a backlink audit. Your top linking domains tell you where your site's authority comes from. Sudden drops in referring domains can signal lost links that were supporting high-traffic pages, worth monitoring before rankings reflect the loss.
Second, it's an internal linking diagnostic. Your top internally linked pages reveal what your site architecture is already emphasizing. If your highest-traffic, highest-RPS pages aren't also your most internally linked pages, you're leaving ranking potential on the table. Building a disciplined SEO strategy around your content model includes treating internal link architecture as a deliberate revenue lever, not an afterthought.
For publishers producing content at any meaningful volume, sitemap management and crawl budget aren't optional topics. They're operational requirements.
Submit your sitemap and keep it current. An outdated sitemap delays indexing of new content, which delays ranking, which delays the pageview earnings that content was produced to generate.
Crawl budget becomes a real constraint for sites with tens of thousands of pages. GSC doesn't show crawl budget directly, but the Page Indexing report's "Discovered - currently not indexed" count is a reliable proxy for crawl budget pressure. If that number is growing, you have more pages than Google is getting to. The solutions:

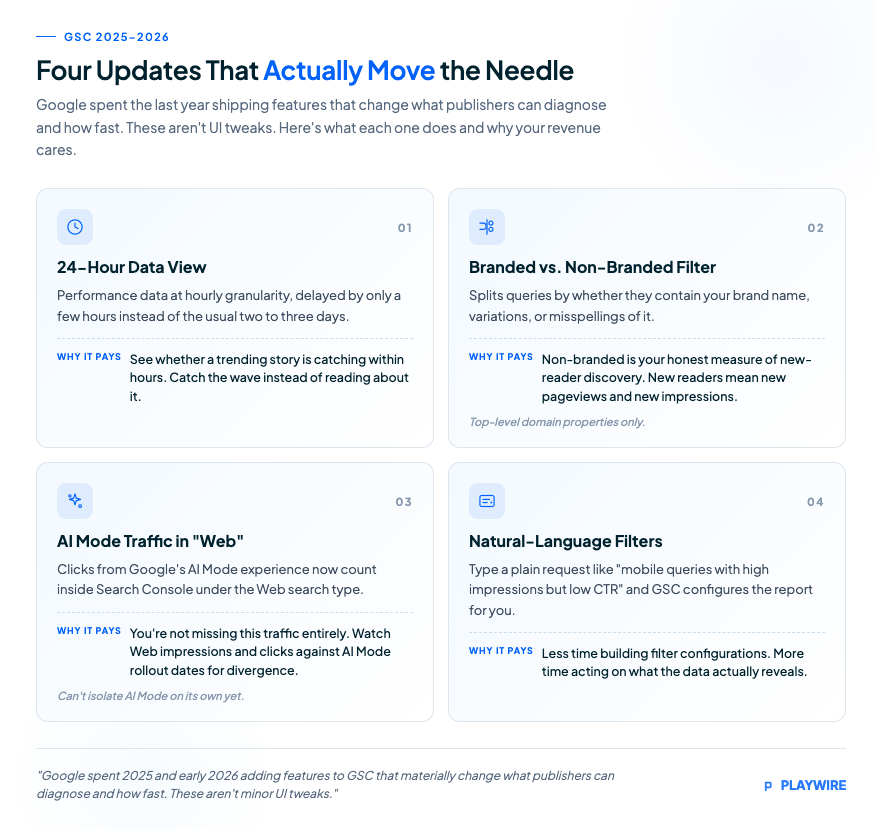
Search Console launched a 24-hour view for performance reports that displays data with only a few hours' delay, showing the recent performance of pages, queries, and published content with hourly granularity. For a publisher who just pushed a trending story, this means you can see whether it's gaining search traction within hours instead of days. That's the difference between catching a wave and reading about it afterward. News publishers especially benefit here: see how SEO for news publishers using Google Search Console for timely content applies this capability to breaking and trending coverage.
For ad-supported publishers, this filter solves a reporting problem that's been persistent for years. Non-branded performance is your honest measure of content strategy effectiveness. Non-branded performance remains the clearest proxy for topical authority, content effectiveness, and organic discovery and reach. Branded traffic tells you people already know you. Non-branded traffic tells you new readers are finding you, which means new pageviews and new ad impressions from audiences you haven't yet tapped.
A few practical constraints worth knowing before you rely on this filter. Google uses an internal AI-assisted system to classify queries, and some queries may be misclassified due to the contextual nature of brand detection. Also, the filter is only available for top-level domain properties, not subdomain or path-level properties, and sites with low impression volume may not qualify.
Traffic from Google's AI Mode search experience is now counted inside Search Console under the "Web" search type, though you can't yet filter exclusively for AI Mode results. You can't isolate it yet, but you're not missing it entirely either.
This matters for publishers trying to understand whether AI search is eating into publisher traffic or sending incremental clicks from traditional results. Watch overall Web search impressions and clicks trend alongside any known AI Mode rollout dates, and flag unexplained divergences between impressions and clicks as a potential AI Mode signal worth investigating.
In December 2025, Google added natural language filters to the Performance report, so instead of manually selecting filters you can type a request like "show me mobile queries with high impressions but low CTR in the last 28 days" and GSC configures the report automatically. Less time building filter configurations means more time acting on what the data reveals.
Any tool you build a revenue strategy on needs a reliability disclaimer, and GSC earned one over the past year. Publishers who lean on this data need to know when the numbers are trustworthy and when they're temporarily broken.
GSC data runs on a delay by design. Performance report data usually has a 2 to 3 day delay. That's normal. What wasn't normal was a stretch of extended outages in late 2025. Google Search Console performance reports stopped updating after October 19, 2025, creating a multi-day data gap. Then, beginning around November 17-21, 2025, the Page Indexing report stopped updating and remained stuck for nearly 30 days. In both cases, Google confirmed the issues were internal data-processing problems on their end, not problems with your website, and they did not affect your site's ranking, crawling, or indexing.
There's also a data accuracy issue worth flagging for anyone using GSC in board decks or client reports. Google Search Console misreported impression data since May 13, 2025 due to a logging error, with corrections rolling out afterward.
The lesson isn't to distrust GSC. Treat any single day's data as provisional. Anchor your decisions to multi-day trends, keep a regular export schedule running, and confirm the tool is actually current before you sound the alarm on a number that looks wrong.
GSC is most valuable when used consistently, not just when something goes wrong. Build checks into your operational calendar the same way you schedule yield reviews. Our revenue-focused GSC workflow for ad-supported publishers lays out exactly how to structure that cadence week to week.
Cadence | What to Review | What You're Watching For |
|---|---|---|
Daily (or 24-hour view) | Recently published high-value content | Whether new content is gaining search traction fast enough to capture trending demand |
Weekly | Performance report (clicks, impressions, position, CTR) | Early signs of traffic drops before they hit pageviews and ad revenue |
After every publish | Page Indexing report and URL Inspection | Confirmation that new content is indexed and eligible to earn traffic |
Monthly | Branded vs. non-branded split, Core Web Vitals, link reports | Whether content strategy is growing new-reader discovery; page speed health; backlink changes |
Immediately | Manual Actions, Security Issues | Any active penalty or compromise that requires urgent response |
The weekly Performance check is your revenue early-warning system. A meaningful decline in impressions or clicks gives you advance notice to investigate before the pageview loss compounds into a revenue problem. If you want to translate those GSC signals into concrete SEO decisions, our guide on SEO publishing best practices and what the data in Google Search Console is telling you covers that translation in detail.
GSC has a hard boundary: it stops at the search result. It reports impressions, clicks, and rankings. It says nothing about what happens once a reader lands on your page and your ad stack takes over.
Your clicks in GSC become sessions on your site. Those sessions generate the pageviews that sit in the denominator of your session RPS, your pageview RPM, and every ad-unit-level metric your yield team watches. When GSC clicks drop, expect pageview volume to follow, and expect total ad revenue to feel it even if your monetization metrics hold steady.
This is exactly why you monitor both layers. Your RPS can look healthy while your total revenue still falls, simply because fewer sessions are flowing from search. Without GSC, that kind of traffic-driven revenue drop is genuinely hard to diagnose. With GSC, you can trace the loss back to a ranking slip, an indexing failure, or a Core Web Vitals regression and fix the actual cause. Our Google Search Console guide for publishers covering traffic, indexing, and ad revenue connects these layers in full.
The GSC-to-GA4 integration closes the loop. Connect the two, and you can follow a query all the way from search impression through session behavior to the ad revenue that session produced. The full funnel in one view.
These are the questions publishers ask most often. Each answer stands on its own.
Google Search Console is used to monitor how your site appears in Google Search results. It shows which pages are indexed, how they rank for specific queries, how often they appear in search results (impressions), how often users click through, and whether Google has encountered any technical issues crawling your site. For ad-supported publishers, it functions as an upstream revenue signal: it shows whether the organic traffic that funds your ad revenue will actually arrive.
Yes. Google Search Console is completely free to use. There is no paid tier or premium version. Any site owner can create a property, verify ownership, and access all reports at no cost.
Google Search Console shows what happens before a user arrives at your site: how your pages appear in search results, whether they're indexed, and what queries they rank for. Google Analytics shows what happens after a user arrives. How they navigate your site, how long they stay, and what revenue their visit produces when ad revenue tracking is configured. GSC is a pre-click tool. GA4 is a post-click tool. Publishers need both.
Performance report data typically carries a 2 to 3 day delay under normal conditions. The 24-hour view, launched in late 2024, updates with only a few hours' delay for recent content performance. GSC has experienced notable data outages: performance reports froze for multiple days starting October 19, 2025, and the Page Indexing report stalled for nearly 30 days beginning November 17-21, 2025. Treat individual data points as provisional and anchor decisions to multi-day trends.
Use the URL Inspection tool. Enter any URL on your site, and GSC will show you whether the page is indexed, when Google last crawled it, and whether any indexing issues exist. You can also review the Page Indexing report for a site-wide view of indexed vs. unindexed pages, broken down by status reason.
Average position is the mean ranking of your page or query across all searches where your site appeared in results during the selected date range. A position of 1 means you appeared first on average. Position 8 means you appeared on the first page but near the bottom. Because it's an average, a single query can show significant variation day to day. Use it directionally, not as a precise rank tracker.
GSC's Performance report stores data for a rolling 16-month window. Once data ages past that point, it's permanently deleted from the tool. Google Search Console operates on a rolling 16-month window for performance data covering clicks, impressions, CTR, average position, queries, pages, countries, and devices. Publishers who need longer historical records for year-over-year comparisons must export their data regularly and warehouse it elsewhere. There is no workaround within the tool itself.
Traffic from Google's AI Mode search experience is counted inside Search Console under the "Web" search type. There is currently no filter to isolate AI Mode clicks or impressions from standard web search clicks. To estimate AI Mode impact, watch your overall Web search impressions and clicks alongside AI Mode rollout milestones, and flag unexplained divergences between impression volume and click-through rate as a potential AI Mode signal worth investigating.
CTR varies significantly by query type, position, and vertical, so there's no universal benchmark that applies to every publisher. Position 1 results see substantially higher CTR than positions 5 through 10. For publishers, the more actionable framing is this: any query where impressions are high and CTR is low relative to your average position represents inventory you're already eligible for but not capturing. That gap is worth closing regardless of what the absolute CTR number is.
GSC hands you the upstream signal. We help you turn that traffic into the maximum possible revenue once it arrives.
Search Console makes sure the pageviews show up. Our RAMP platform makes sure every one of those pageviews earns everything it can, through header bidding, AI-driven price floor optimization, direct demand from our global sales team, and real-time analytics that show you exactly how each piece of content monetizes.
Here's how the two layers work together in practice:
The publishers who win watch both ends of the pipeline. They use GSC to protect and grow the traffic, and they use a serious monetization partner to amplify the revenue that traffic produces.
Want to see how much more your existing search traffic could be earning? Apply to work with us and we'll run a side-by-side comparison on your site.
We'll email you a downloadable PDF version of the guide and you can read later.