


August 3, 2023
Editorial Policy
All of our content is generated by subject matter experts with years of ad tech experience and structured by writers and educators for ease of use and digestibility. Learn more about our rigorous interview, content production and review process here.
Key Points
- To accurately troubleshoot changes to your CPMs, you’ll first need to analyze and compare both your fill rate and eCPM rates.
- There are several factors that can impact your CPMs, including the type of device the ads are being viewed on, the geographical breakdown of your website's traffic, your viewability, and your click-through rate.
- Understanding the impacting factors and how they might affect your CPMs requires extensive time and advanced technical know-how. If you’re looking for the “easy button,” Playwire is always here for you.
Imagine you’re running a lemonade stand, and your lemonade is known for its premium quality and unique recipe. Because of your stellar reputation, customers are always willing to pay top dollar for a cup.
Then one day you take a sip of your lemonade and notice that it tastes too bitter. Now, as word gets out about the taste of your lemonade, customers become less willing to pay a premium, which forces the price you can charge for your lemonade to drop significantly.
That's what a drop in CPM rates feels like. Just like the taste and quality of your lemonade impacts the price you can charge, CPM rates signify the value advertisers place on your ad inventory. While a drop in CPM rates can be caused by a number of factors, the results are always the same: less revenue in your pocket.
Just like anything in ad tech, troubleshooting changes in CPMs is no walk in the park and certainly not as simple as adding more sugar to your lemonade recipe. You have to start by identifying the root cause and often will need to do a bit of testing to identify and fix the issue.
Interested in learning more about the process for troubleshooting changes to your CPMs? Then you are definitely in the right place. In this article, we’ll walk you through how to identify any changes to your CPMs, regardless of whether they’re good or bad, as well as why they may be happening.
The Misconception of Low CPMs and Revenue
It's important to note that in the complex world of digital advertising, things aren't always as they seem. Sometimes, even though it appears that there has been a drop in your CPMs, a closer look at two additional metrics, eCPM and fill rate, may reveal a different story.
Let’s say one day you sell your lemonade for $1 per cup (CPM) but manage to sell it to only half of your customers (50% fill rate). This means you earn $0.50 per person (eCPM). But the next day, you decide to sell your lemonade for $0.75 per cup (CPM), and more people want to buy them, so you manage to sell them to 75% of customers (75% fill rate). On the surface, you did sell your lemonade for less money (a drop in CPM), but there's a lot more to consider here.
When we look at the money you actually made per person, it turns out that on the second day, you earned $0.56 per person. So, even though your selling price, or CPM, dropped, your eCPM increased from $0.50 to $0.56.
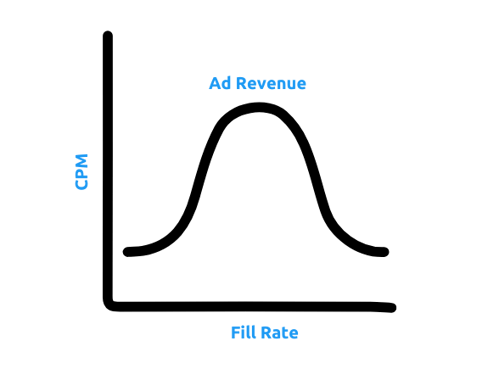
As you can see, it's important to compare both your fill rate and eCPM, in addition to your CPM rate, during the same time period and track your performance over a longer time period before jumping to conclusions.
This is where testing and a bit of patience come into play. By testing the waters and lowering the price you were charging per cup of lemonade, you increased the quantity of customers who came to your stand, increasing your fill rate, which in turn earned you more revenue overall.
-- Article Continues Below --

A Guide for Website Publishers: How to Manage and Monitor Your Ad Revenue Metrics
Identifying the Source of CPM Drops
As previously mentioned, encountering a decline in your CPMs doesn’t automatically mean things are going south. Nonetheless, when it does point to a less-than-ideal situation, it's important to know how to figure out the root cause and tackle it head-on.
Below is a list of some key factors you should always be checking if you ever see a drop in your CPMs.
Ad Units
When looking for trends that might explain the drop in your CPMs, a good place to start is establishing whether the issue affects all ad units or only specific ones.
If you’re encountering issues across all ad units, it may be necessary to investigate external factors that could be influencing the overall market, such as market conditions and industry trends. However, if the issue is only occurring with one specific ad unit, it could be a result of lower engagement or effectiveness. In that case, it would be beneficial to check internal factors such as placement, targeting settings, and the performance of those ad units.
Rule of Thumb: Always be sure to consider the size of the ad unit. Typically, larger ad units tend to have higher CPMs.
For instance, a 300 x 600 ad unit would generally have higher CPMs compared to a 300 x 250 unit. Similarly, a 720 or 970 x 250 unit would typically yield higher CPMs than a 728 x 90 unit.
Type of Device
Different devices can have different CPMs; you may see a drop in rates on desktops while mobile devices remain unaffected. In such cases, it's a good idea to take a close look at your ad formats and placements specific to desktop devices. By doing so, you can ensure that they are optimized for desktop viewing and provide a seamless user experience.
By analyzing CPM changes across specific devices, you can identify inconsistencies in ad performance, user behavior, targeting, and other key factors. Whether it's on a desktop, tablet, mobile device, or all of the above, making device-specific changes to your ad monetization strategy is a great way to optimize your CPM rates.
Geographical Breakout
The geographical breakdown of your website's traffic can significantly influence CPMs. Here's a breakdown of countries, listed from highest CPM to lowest:
- United States
- International countries such as Australia, Canada, New Zealand, Norway, and Switzerland
- General Data Protection Regulation (GDPR) countries
- Remaining countries
It's worth noting that CPM issues can also be specific to certain countries.
Supply-Side Platforms (SSP)
If you encounter a change with your CPMs, you may want to consider checking the historical performance across each of your demand sources. This will help you determine if the number of active Supply-Side Platforms (SSP) decreased or stopped spending recently.
If a website has 10 SSPs running daily and two of those SSPs suddenly stop spending, the bid density in the stack will decrease, lowering competition and CPMs because there is less rivalry in the auction.
This information can also help you determine if there’s a specific SSP that has had a significant drop in CPMs. For example, the SSP was spending about $0.50 on average, and then it dropped to $0.25 suddenly.
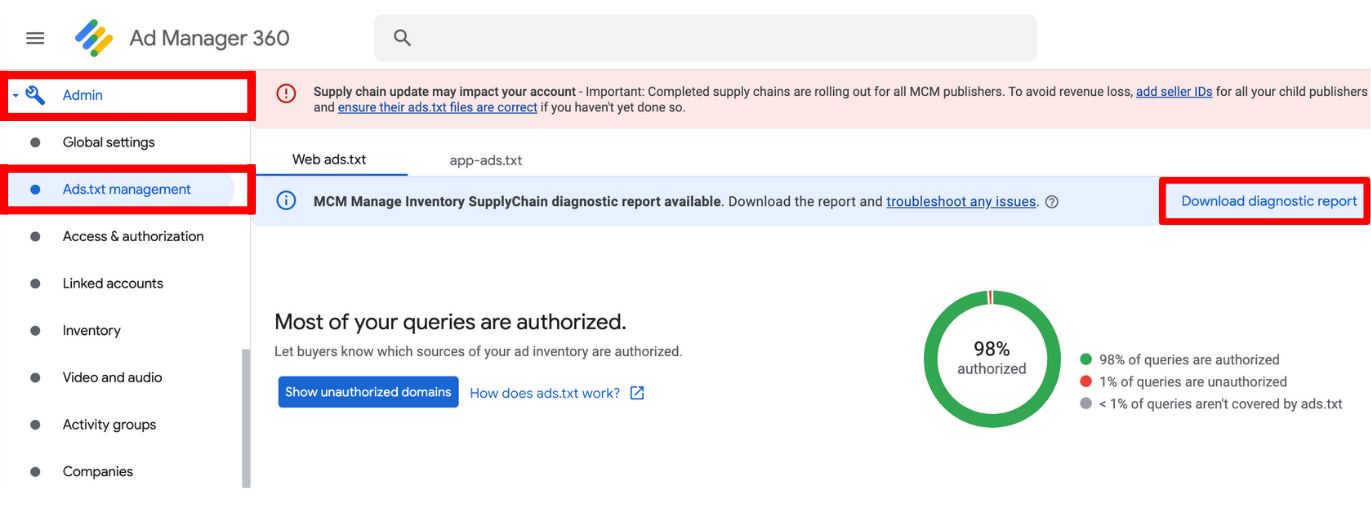
If issues with a particular demand source (or multiple sources) are confirmed, it's important to verify that your ads.txt file has been installed correctly. The absence of an ads.txt file or a broken SChain can heavily contribute to low fill rates.
To check your ads.txt in GAM, follow these steps:
- Ensure that your ads.txt is up, and confirm it’s been authorized and is being crawled by checking your ads.txt reporting in GAM.
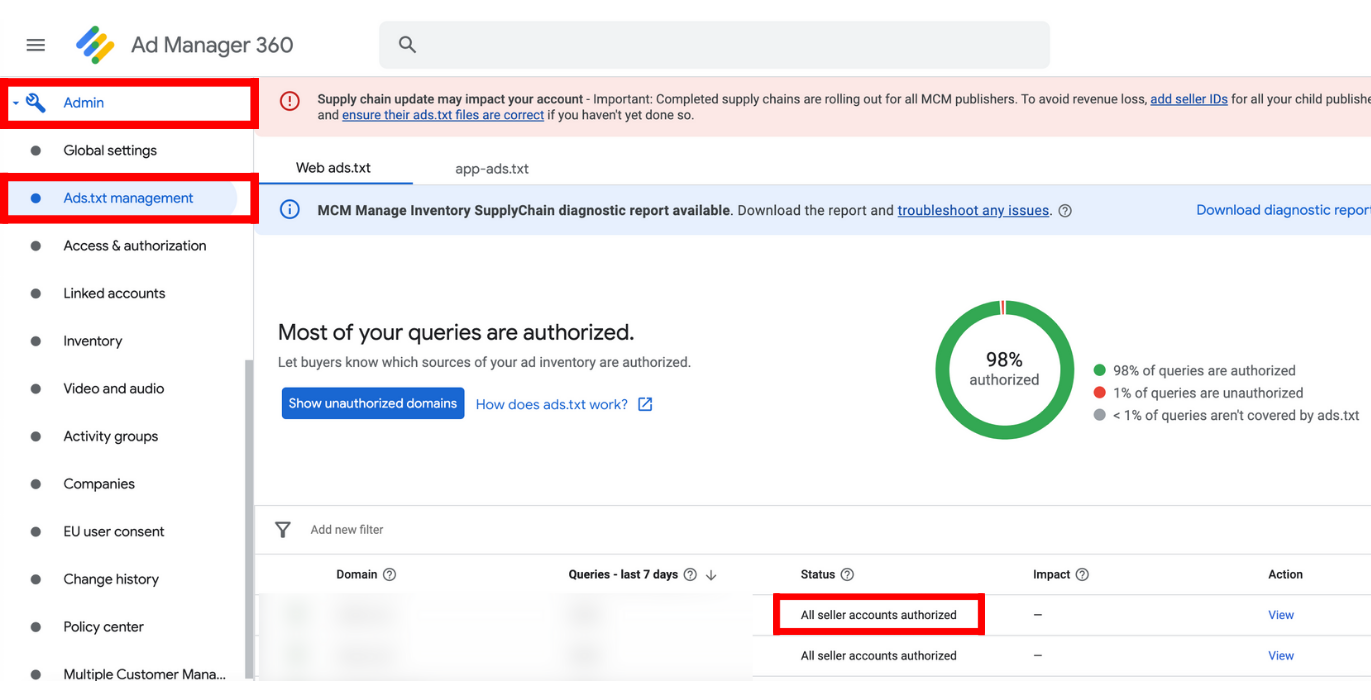
2. Check that the SChain is authorized.
If the ads.txt is not installed correctly, reinstall the file and check GAM to ensure proper installation.
If no recent changes have been made to the ads.txt file, it may be necessary to reach out to your ad provider, if applicable, or seek assistance from GAM support for further guidance.
-- Article Continues Below --

Check out The Complete Ads.txt Resource Center
Refresh Count
Each refresh count represents a new opportunity to optimize CPM rates. If the refresh count has decreased, you can expect that CPMs will also decrease as you go further down the line. However, if you notice changes in CPMs for a particular refresh count between date ranges, there may be a potential issue with the refresh count.
For example, if CPMs drop by X% during the initial page load and you don't see a similar drop in CPMs as you move down the refresh count line, this could indicate a problem.
Similarly, if your CPMs remain consistent for the initial impressions but show a decline specifically in the CPMs for refreshed impressions, this may also indicate a problem.
Once you identify such issues, it's crucial to delve deeper into metrics related to refreshed impressions, including viewability, click-through rate, and more.
First things first, you need to actually run a report on CPMs by refresh count in order to have the proper metrics to dive into. Complete the steps below in order to run a report on CPMs by refresh count in GAM:
- Start by opening GAM and click Reporting on the left side of your screen.
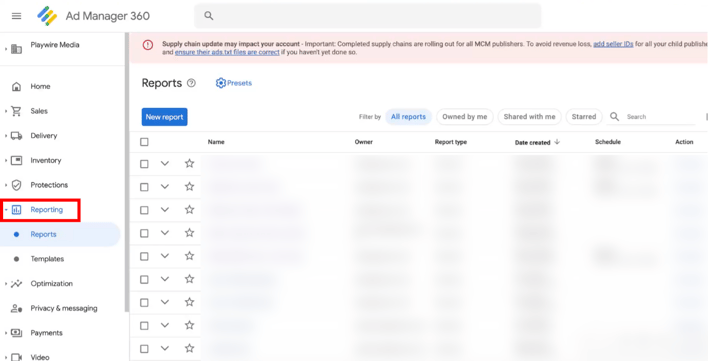
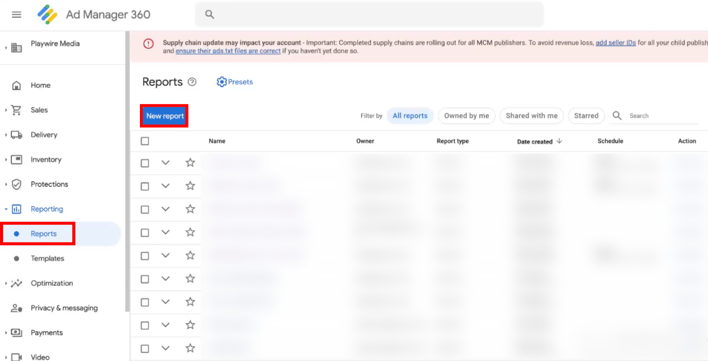
- Click Reports and then select New Reports.
- Scroll down to Time Zone. There, with the Dynamic date range selected, you can click last 7 days, last 30 days, etc.
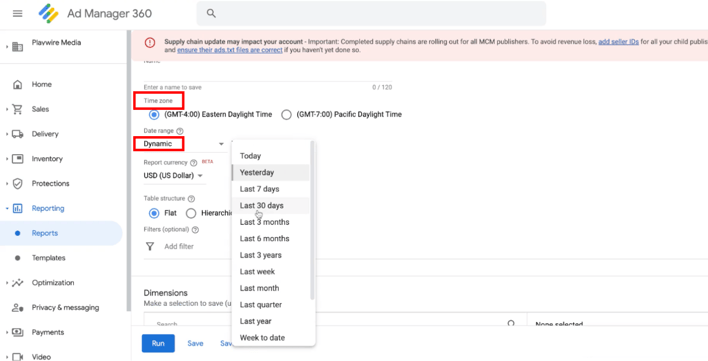
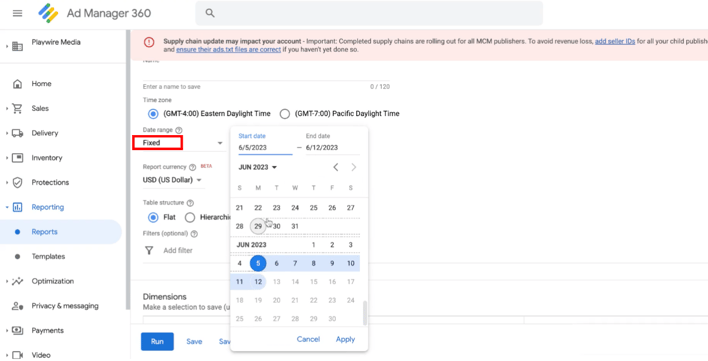
- Or, if you need a specific time frame, you can click the Date Range drop-down menu and click Fixed and input your specific time frame there.
- Once you've selected your date range, scroll down to Add Filter.
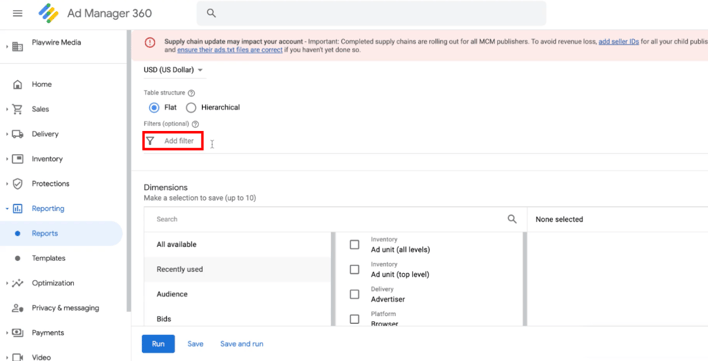
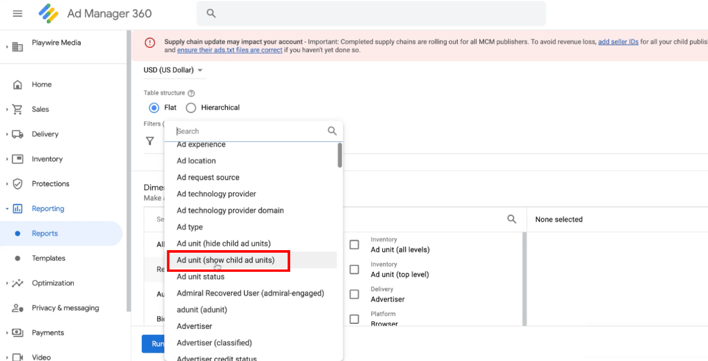
- Click Ad unit (show child ad units).
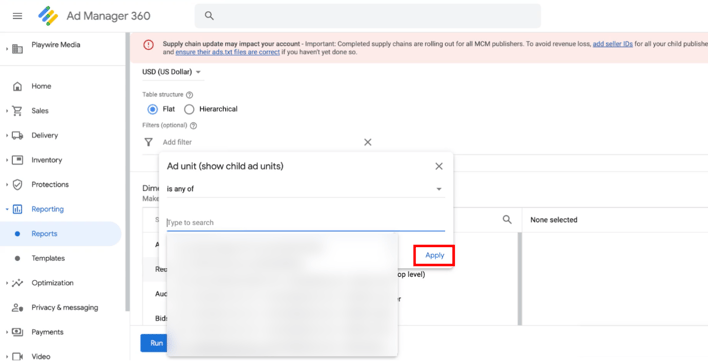
- Type in the name of the site you’d like to pull, select it, and click Apply.
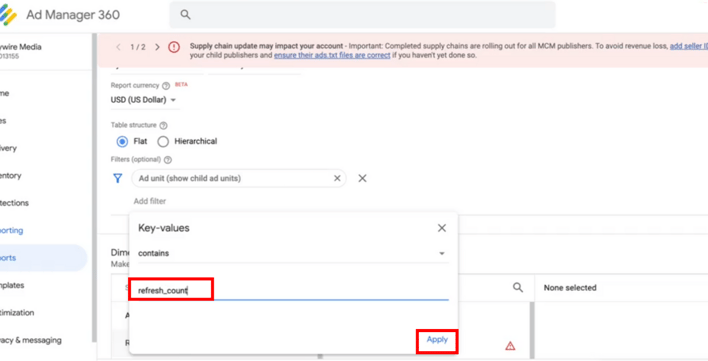
- Then, click Add Filter again and select Key-values.
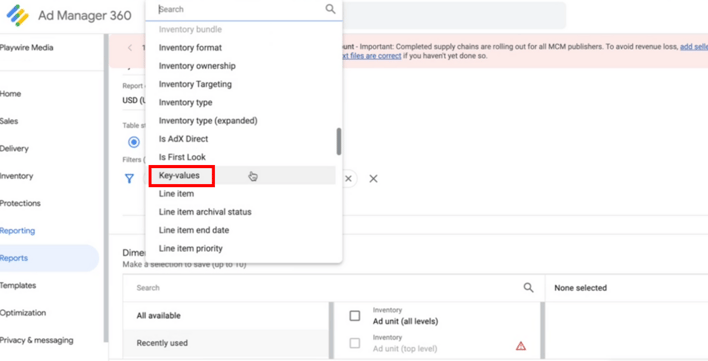
- Once you click on Key-values, filter it out just for refresh count by typing in “refresh_count," and then clicking Apply.
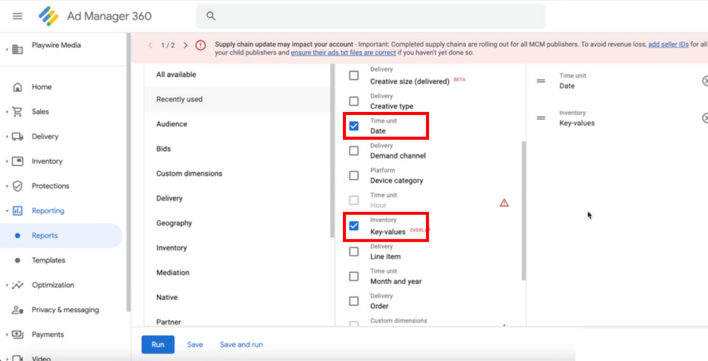
- Next, scroll down to the Dimensions section below.
- Select the Key-values dimension, plus any other dimension you want depending on if you want it broken down by date, by the time frame you selected earlier, etc. However, be sure to select the Key-values dimension regardless of what other dimensions you select. For our example, we selected Date and Key-values as our dimensions.
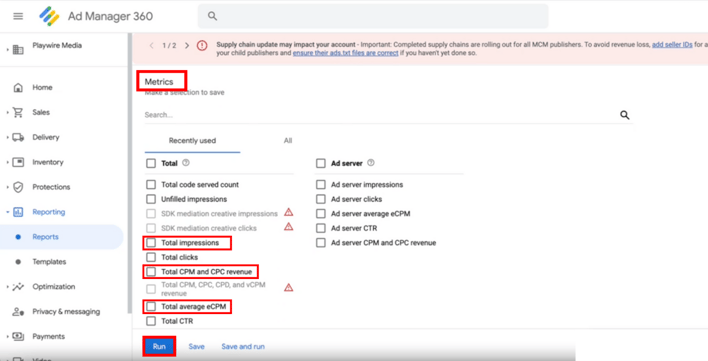
- Once you’ve selected your dimensions, scroll down to the Metrics section below and select Total Impressions, Total CPM and CPC Revenue, and Total Average eCPM.
- After selecting those three metrics, click Run.
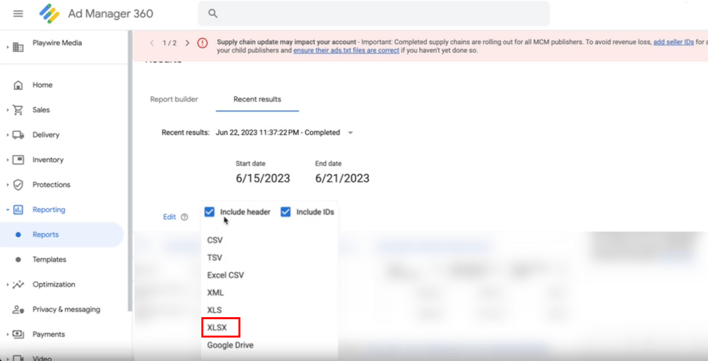
- Once the report populates, export it to Excel by clicking Export Results, and then XLSX in order to pivot it out.
- Once your new Excel file opens, click the Report Data Excel sheet and insert a Pivot Table.
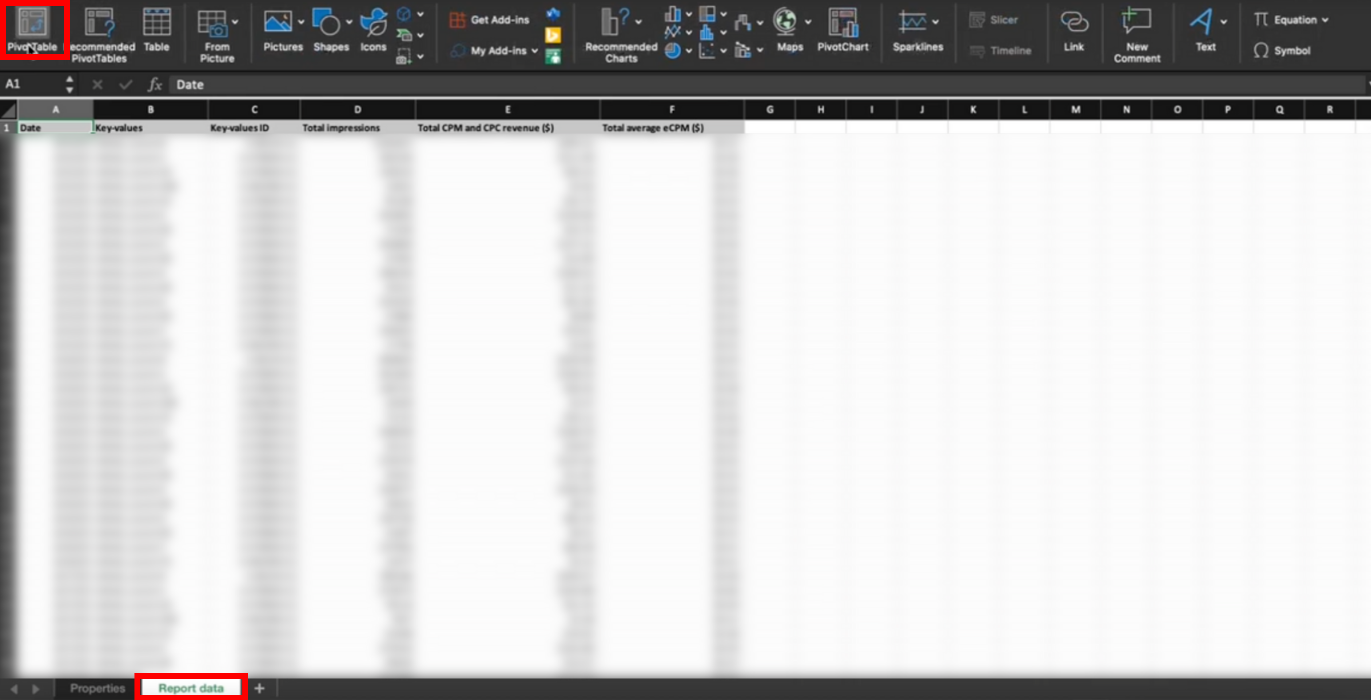
- In the PivotTable Fields on the right side of your screen, drag Key-values and Date into the Rows section.
- Then, drag Total Impressions, Total CPM and CPC Revenue, and Total Average eCPM into the Values section of the PivotTable Fields. This will allow you to see impressions, revenue, and CPM by refresh count, and compare it by day.
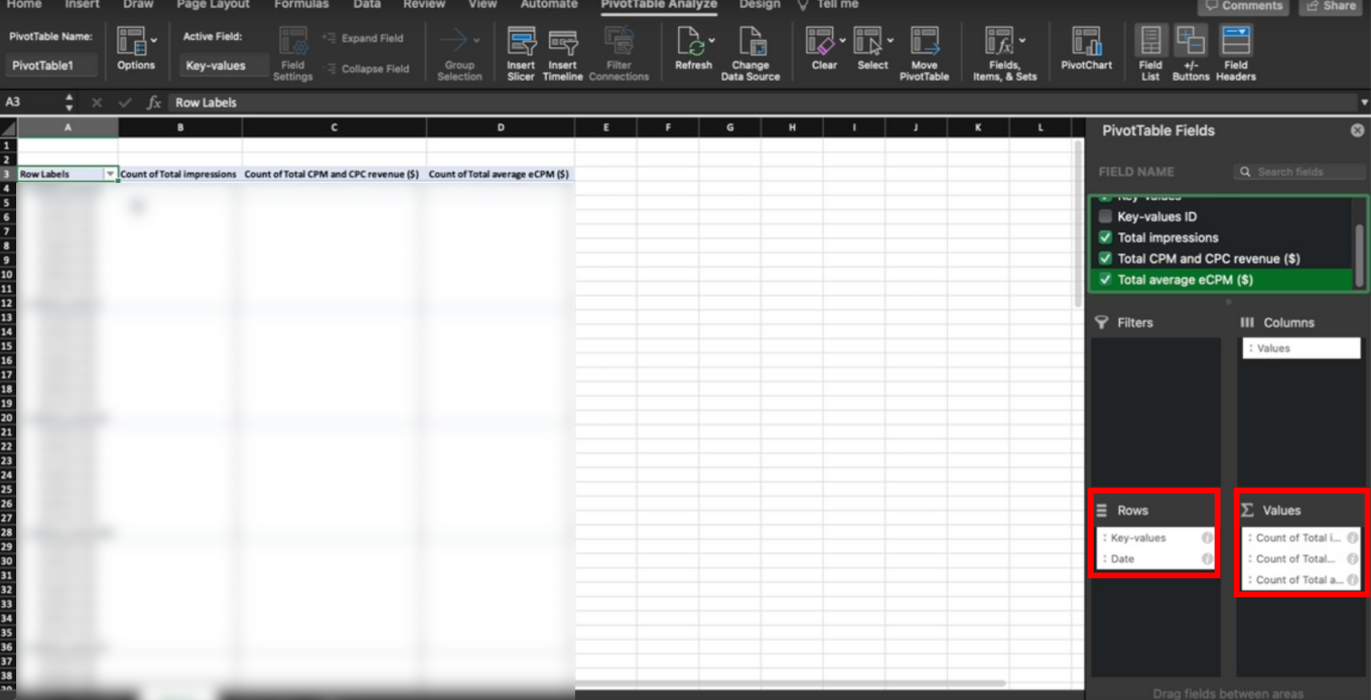
- Next, change each of those values to Sum by clicking the “ i ” next to the name of the value, selecting Sum, and then selecting OK.
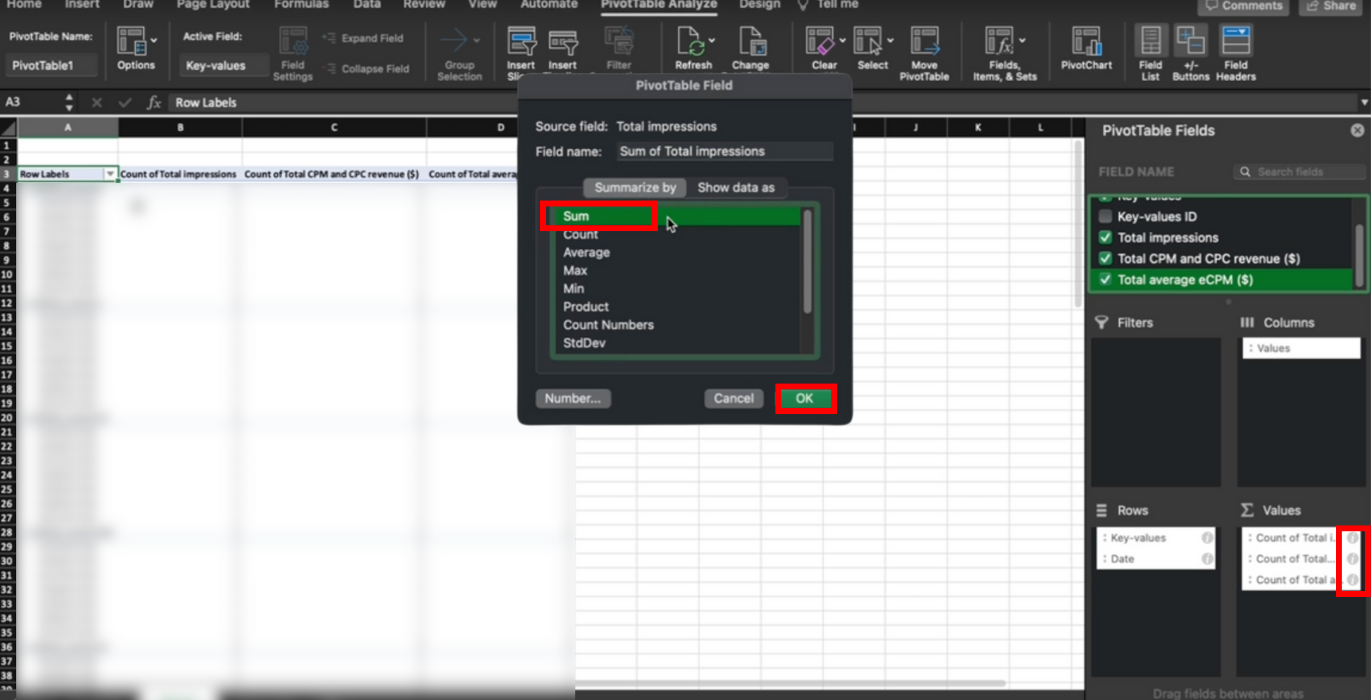
- Once you do that, be sure to note that the refresh count will not be in order. You can sort it in order by right-clicking the first Sum of Total Impressions cell, selecting the Sort drop-down menu, and clicking Sort Largest to Smallest.
Viewability, Click-Through Rate (CTR), & Video-Completion Rate (VCR)
Generally, the higher the viewability and click-through rate of a unit, the higher the CPM. However, if viewability and/or CTR have decreased at a similar or the same rate as the CPM, there may be a viewability issue.
As for video completion rate (VCR), if your site is using video, this is one of the primary metrics that will affect CPMs. If your video ads have a 30% VCR, advertisers know that the ad is likely not going to be seen from start to finish, and CPMs will be lower. If your video ads have an 80% VCR, CPMs will naturally be higher.
Additional Factors to Consider
- Day of the Week & Time of Day: SSPs spend the most in the first 10 minutes of the hour and then reset. Therefore, the time of day and day of the week can all technically affect CPMs.
- Invalid Traffic: If an SSP identifies that a website's traffic, or a portion thereof, is invalid, it will absolutely impact your CPMs.
- Personalized vs. Non-personalized Ads: When a user chooses to opt out of personalized ads by not accepting cookies, it significantly impacts CPMs. In fact, CPMs for these users can be notably lower, potentially 2-3 times lower, compared to users who consent to cookies and view personalized ads.
- Seasonality: At the beginning of a new month, quarter, or year, CPMs tend to drop as advertiser budgets reset. For instance, during Q4, leading up to the holidays, CPMs generally soar, surpassing the levels seen in other seasons. However, once December 26th rolls around, websites transition into Q1, which typically leads to a notable decrease in CPMs. It’s not uncommon to see CPMs drop by around 30% during this period, and such fluctuations in CPM rates should be expected as part of the seasonal cycle.
Playwire: Squeeze the Most Out of Your Revenue Potential
If you’ve reached this point in our journey together, you now recognize that identifying why changes to your CPMs are happening and how to resolve them is no easy feat. There are an endless quantity of factors you need to monitor in reference to your CPM rates, and doing so can take a significant amount of time, resources, and technical know-how.
Luckily, we’ve built a team with both the depth and breadth of expertise needed to both diagnose and troubleshoot any problem we come across, CPM-related and far, far beyond.
Eager to ensure your CPM rates are working for you and not against you? Contact Playwire today.
