


August 1, 2023
Editorial Policy
All of our content is generated by subject matter experts with years of ad tech experience and structured by writers and educators for ease of use and digestibility. Learn more about our rigorous interview, content production and review process here.

Key Points
- Ad spending follows a rhythmic pattern that typically aligns with consumer habits such as peaking in Q4 due to the holidays.
- Yearly, quarterly, and monthly ad spending exhibit a sawtooth trend based on seasonal internet usage and user behavior.
- Daily and hourly spend patterns vary significantly based on a variety of factors including budgets, user engagement, attention spans, and geography.
Welcome to the world of programmatic advertising seasonality, where every advertiser is an artist, and every impression is a note in their grand symphony of ad strategy.
In this symphony, the timing of ad spend is critical. It follows the ebbs and flows of seasons, months, and even the hours of each day.
Now, in ad tech, we all know that knowledge is power. Understanding how and why ad revenue-related changes occur is the key to successfully navigating through them and coming out in the positive on the other side.
With that, let’s dive into this intricate dance and decode yearly, quarterly, monthly, weekly, and daily programmatic advertising spending patterns.
-- Article Continues Below --

Check out The Complete Programmatic Advertising Guide: What Publishers and Advertisers Need to Know.
Consumer Spending Patterns vs. Advertiser Spending Patterns
Finding the right interplay between consumer and advertiser spending patterns is like mastering the tango. Both parties move to their own rhythm yet are intimately connected.
Consumer Spending Cadence
There’s a method to the madness when it comes to consumer spending. Consumers aren’t aimlessly flinging around their funds.
In fact, their spending habits have a distinct rhythm, a pattern that tracks with the changing seasons. Q4 is the crescendo, where spending peaks, and for a fairly obvious reason — the holiday season.
Research from the National Retail Federation puts spending on winter holiday gifts and celebrations at around $832 billion for 2022, on par with data from previous years.
Starting in October and peaking in December, the holiday season is a major influence that advertisers simply cannot ignore.
Advertiser Spending Rhythm
Advertisers are fairly skilled dancers, able to stay in step with their consumer counterparts.
They set their budgets yearly, quarterly, monthly, and even weekly, staying in tune with the cadence of consumer spending.
If consumers spend more during Q4, advertisers need to begin their preparations during Q3.
But that doesn't mean they should exhaust their budgets right away. They need to maintain a steady tempo, ensuring they can change the rhythm in response to the peaks and troughs of consumer behavior and spending.
It’s a fine-tuned balancing act that pairs consumer spending trends with enough wiggle room to adjust steps as needed.
Yearly Programmatic Ad Spend Pattern
Keeping with our music theme, as we dive into the rhythms of programmatic spending throughout the year, think of a well-crafted piece of music.
January acts as a soft opening, setting the stage for the crescendo in Q4. To put it in visual terms, think of a sawtooth pattern with its consistent ebb and flow, as represented in the below graphic.
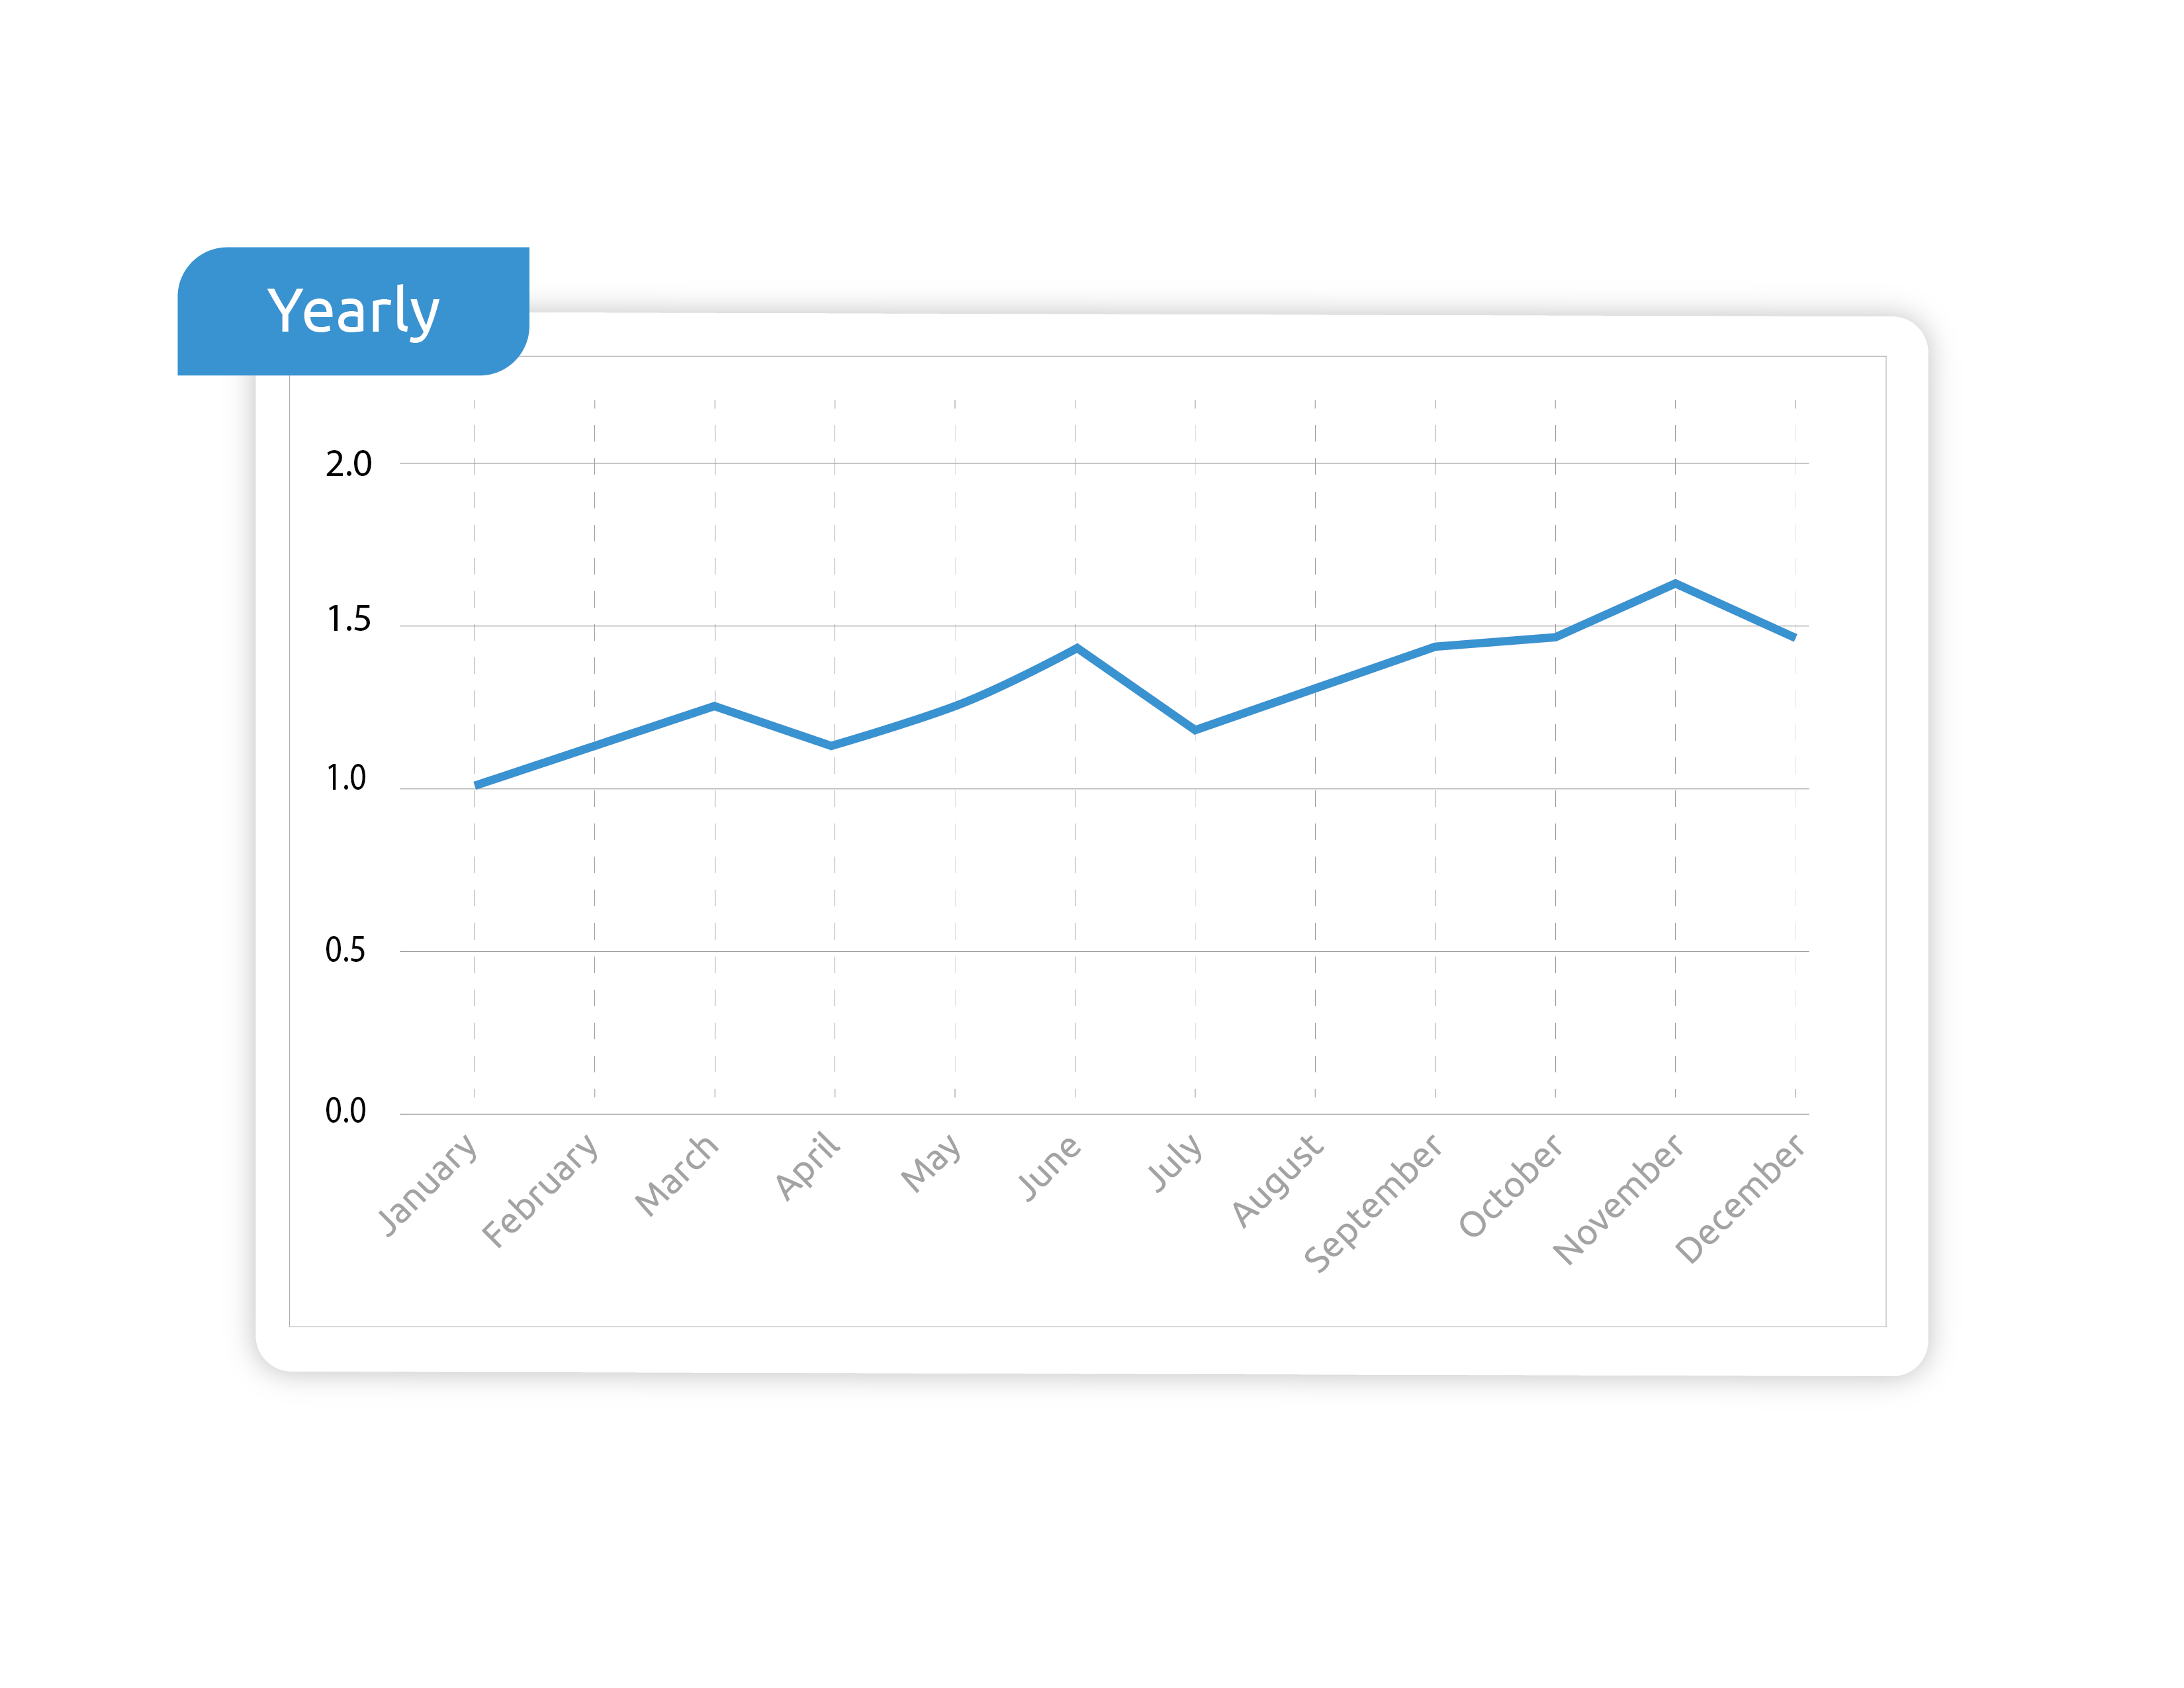
Let’s further explore some of the yearly spend fluctuations you see above that an advertiser might experience:
- January acts as our baseline for spending.
- Spend gradually increases throughout the spring, hitting a seasonal high around March.
- While we’re seeing progress, we’re also seeing a dip in April.
- Summer months show a steady rise with slight variations in spend.
- Momentum picks up in the fall, with August, September, and October setting highs.
- Not to be outdone, November peaks with December coming in at a close second.
Q4 is the time for advertisers to shine. As consumers are busy making holiday purchases, advertisers are hard at work trying to secure their piece of the grand end-of-year spending spree.
It's a meticulously planned performance, culminating in a powerful display of finely-tuned programmatic advertising strategies.
Then, like the final note that no one expected, comes January 1st.
Arguably the worst day of the year for ad spend, it never fails to surprise. When we think the performance is over, this seemingly unassuming day takes the stage. It's the unexpected solo that follows the grand orchestra, the silent but impactful finish to a symphony of ad spend.
Getting this programmatic advertising pattern right can unlock some true growth.
Year Halves and Internet Usage
While many advertisers don’t pay much attention to breaking the year down into halves, there are still some insights we can learn from tracking spending this way:
- Summer internet usage slump: You’ll often see a decrease in internet usage during the summer. This drop-off can create scarcity in user engagement, leading to a competitive landscape for advertisers vying for the limited audience attention.
- Site-specific impact: The seasonal shift impacts different websites uniquely, dictated by their specific user behavior as well as the vertical or verticals in which their content exists.
How can spending relate to site content? Here are a few key examples:
- Finance sites often see a surge in spending during Q1 due to tax season.
- Educational sites may see a drop in traffic during the summer off-months while schools are closed.
-- Article Continues Below --

Quarterly Programmatic Ad Spend Pattern
Much like the ebb and flow of the year, programmatic advertising trends follow a crescendo-like quarterly pattern as well. Think of each quarter as a new movement in our extended advertising symphony, with each quarter building on the hype of previous quarters.
Again, the rhythm follows a sawtooth pattern, such as the one we have visualized below.
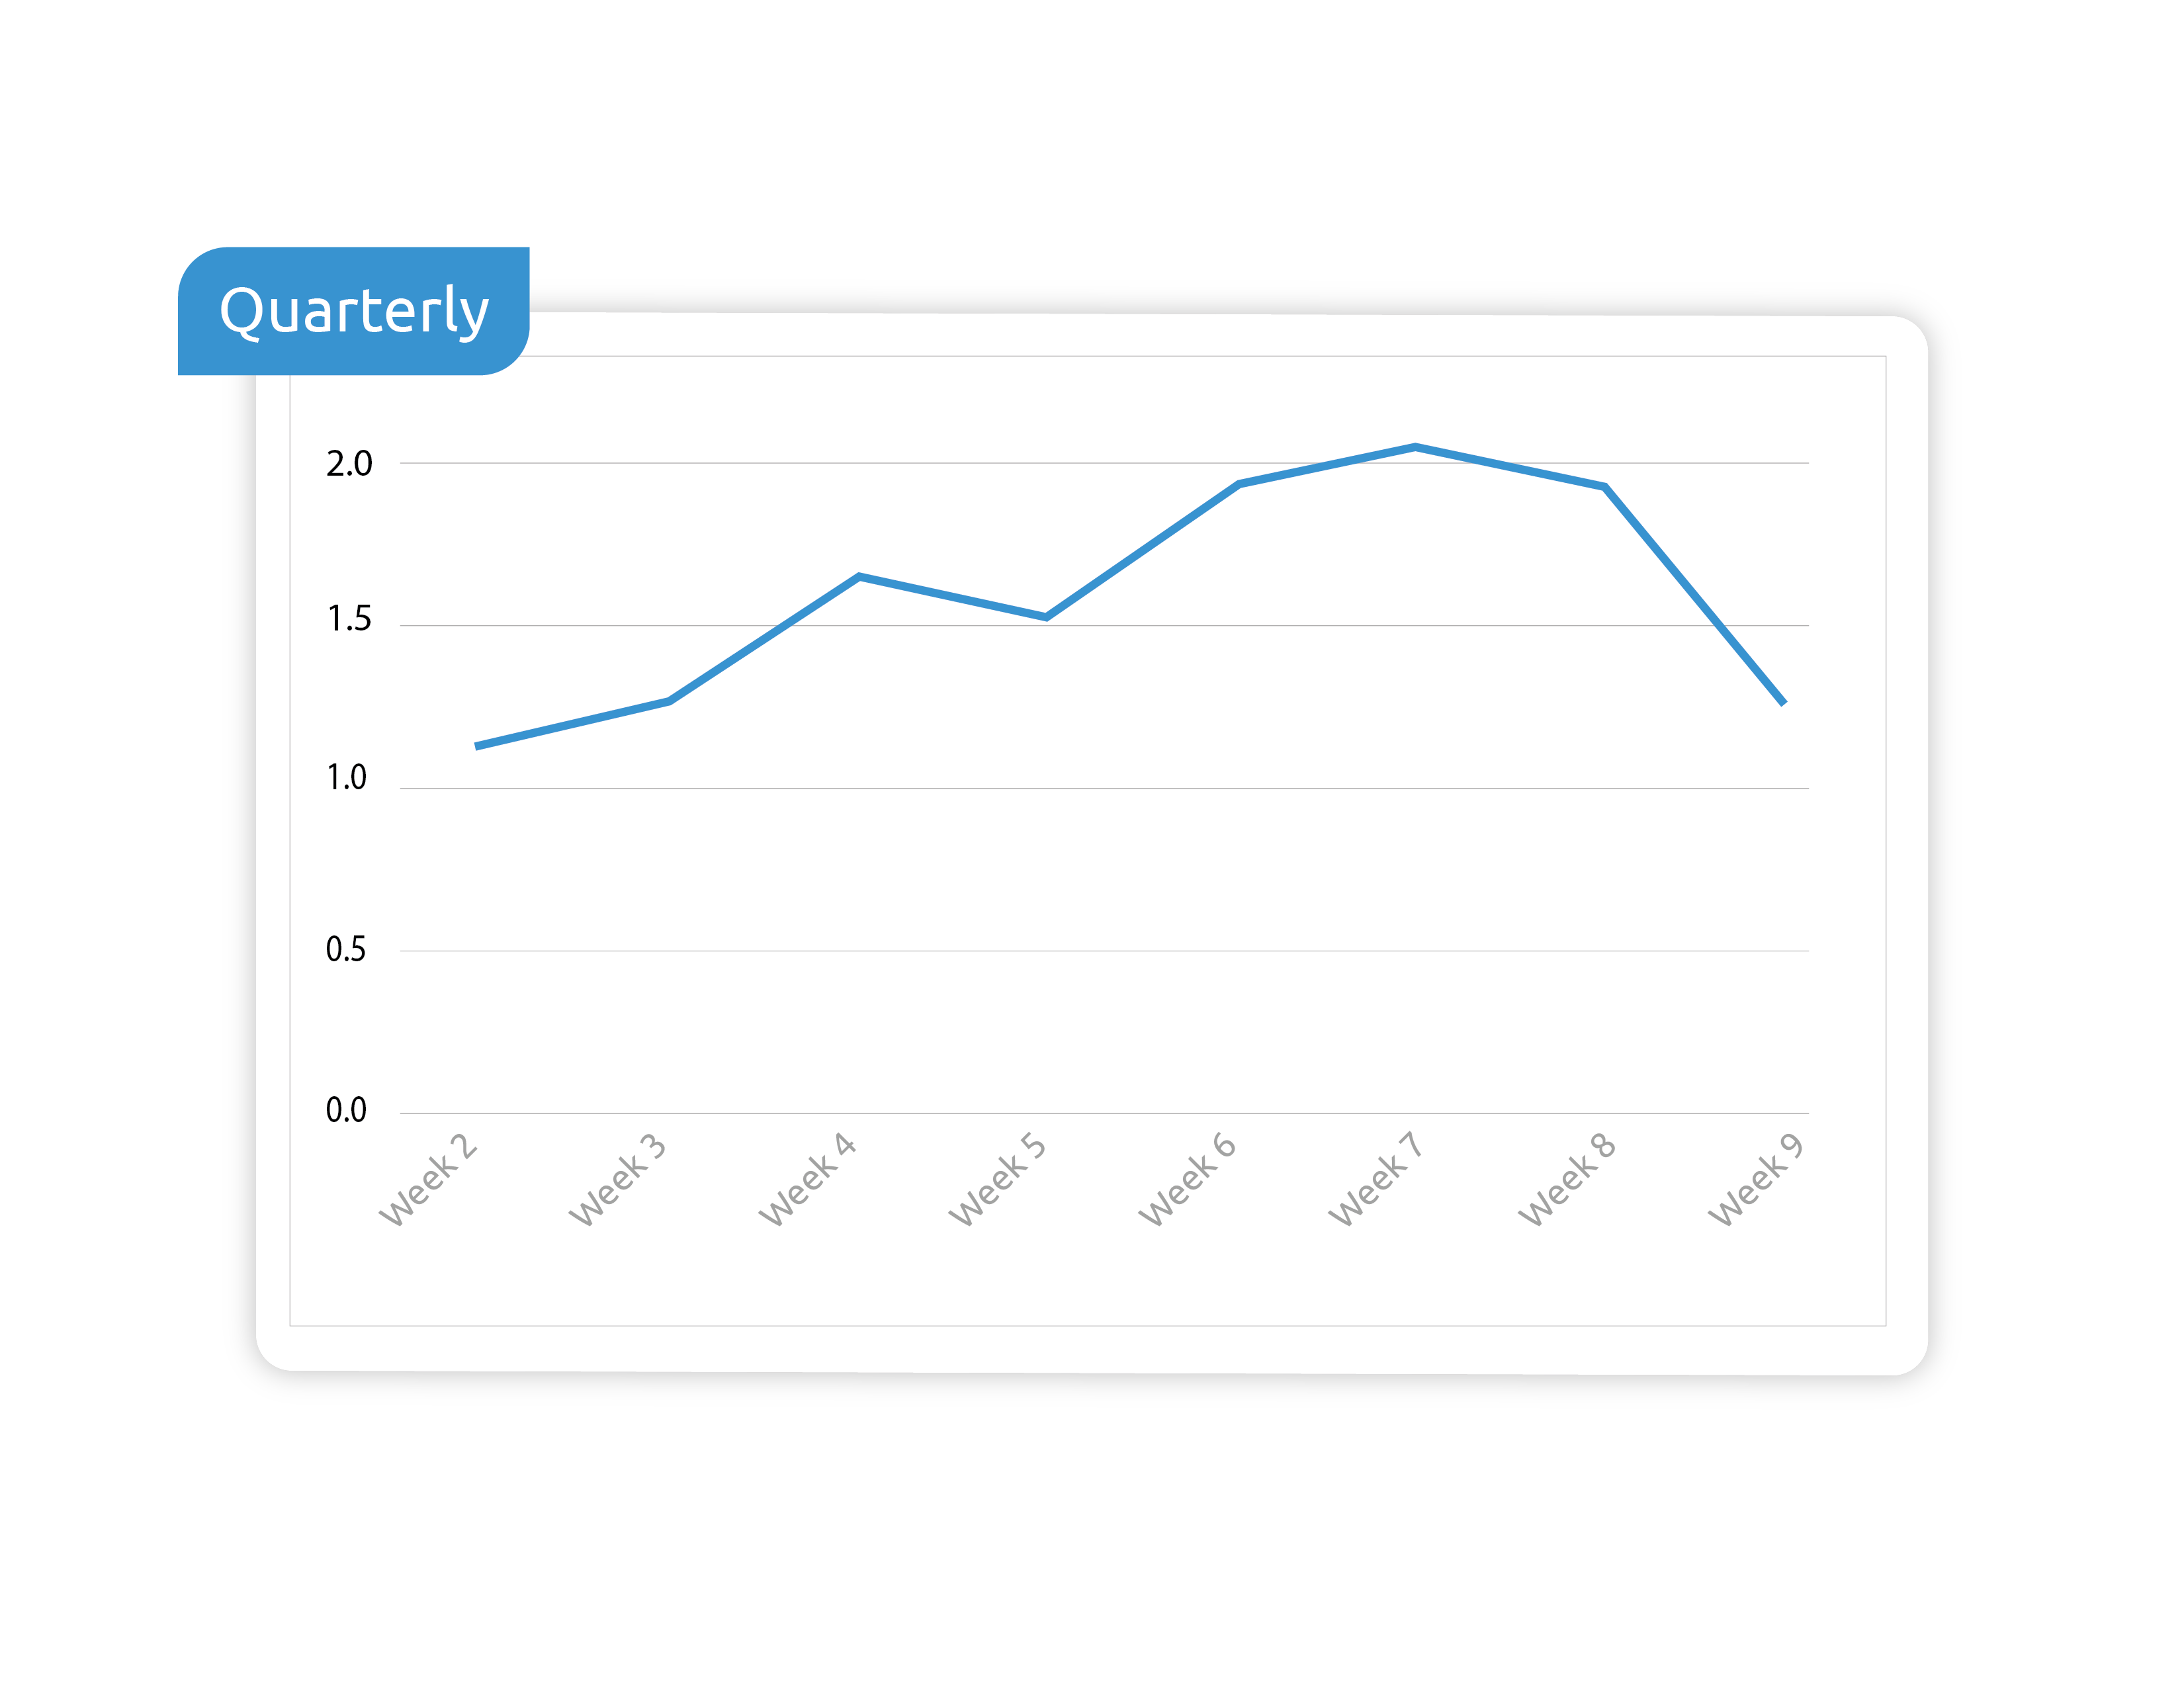
We start nice and steady in the first month, build up in the second to finish strong in the third month of the quarter.
Keep in mind the exception to this rule — December.
December dances to its own beat, often guided by the holiday calendar. Because of this trend, the dates of Thanksgiving and Christmas act as markers for the changes in tempo during Q4.
Thanksgiving starts as the opening act of the big holiday spending show. If it arrives on the earliest date, November 22nd, it gives advertisers the longest possible runway to the main event.
This extended period is like a long, energetic jam session, where publishers can ride the high CPM waves for a full five weeks.
On the flip side, a late Thanksgiving can mean a shorter spending session, leading to a condensed, yet intense, four or three-and-a-half-week CPM increase. The anticipation for the Hanukkah and Christmas finale doesn't wane, maintaining high CPMs throughout the season.
Monthly Programmatic Ad Spend Pattern
Much like yearly and monthly programmatic ad spending, monthly patterns follow a similar sawtooth pattern. We start the month fairly calmly, building over the weeks to finish with a peak toward the end of the month.
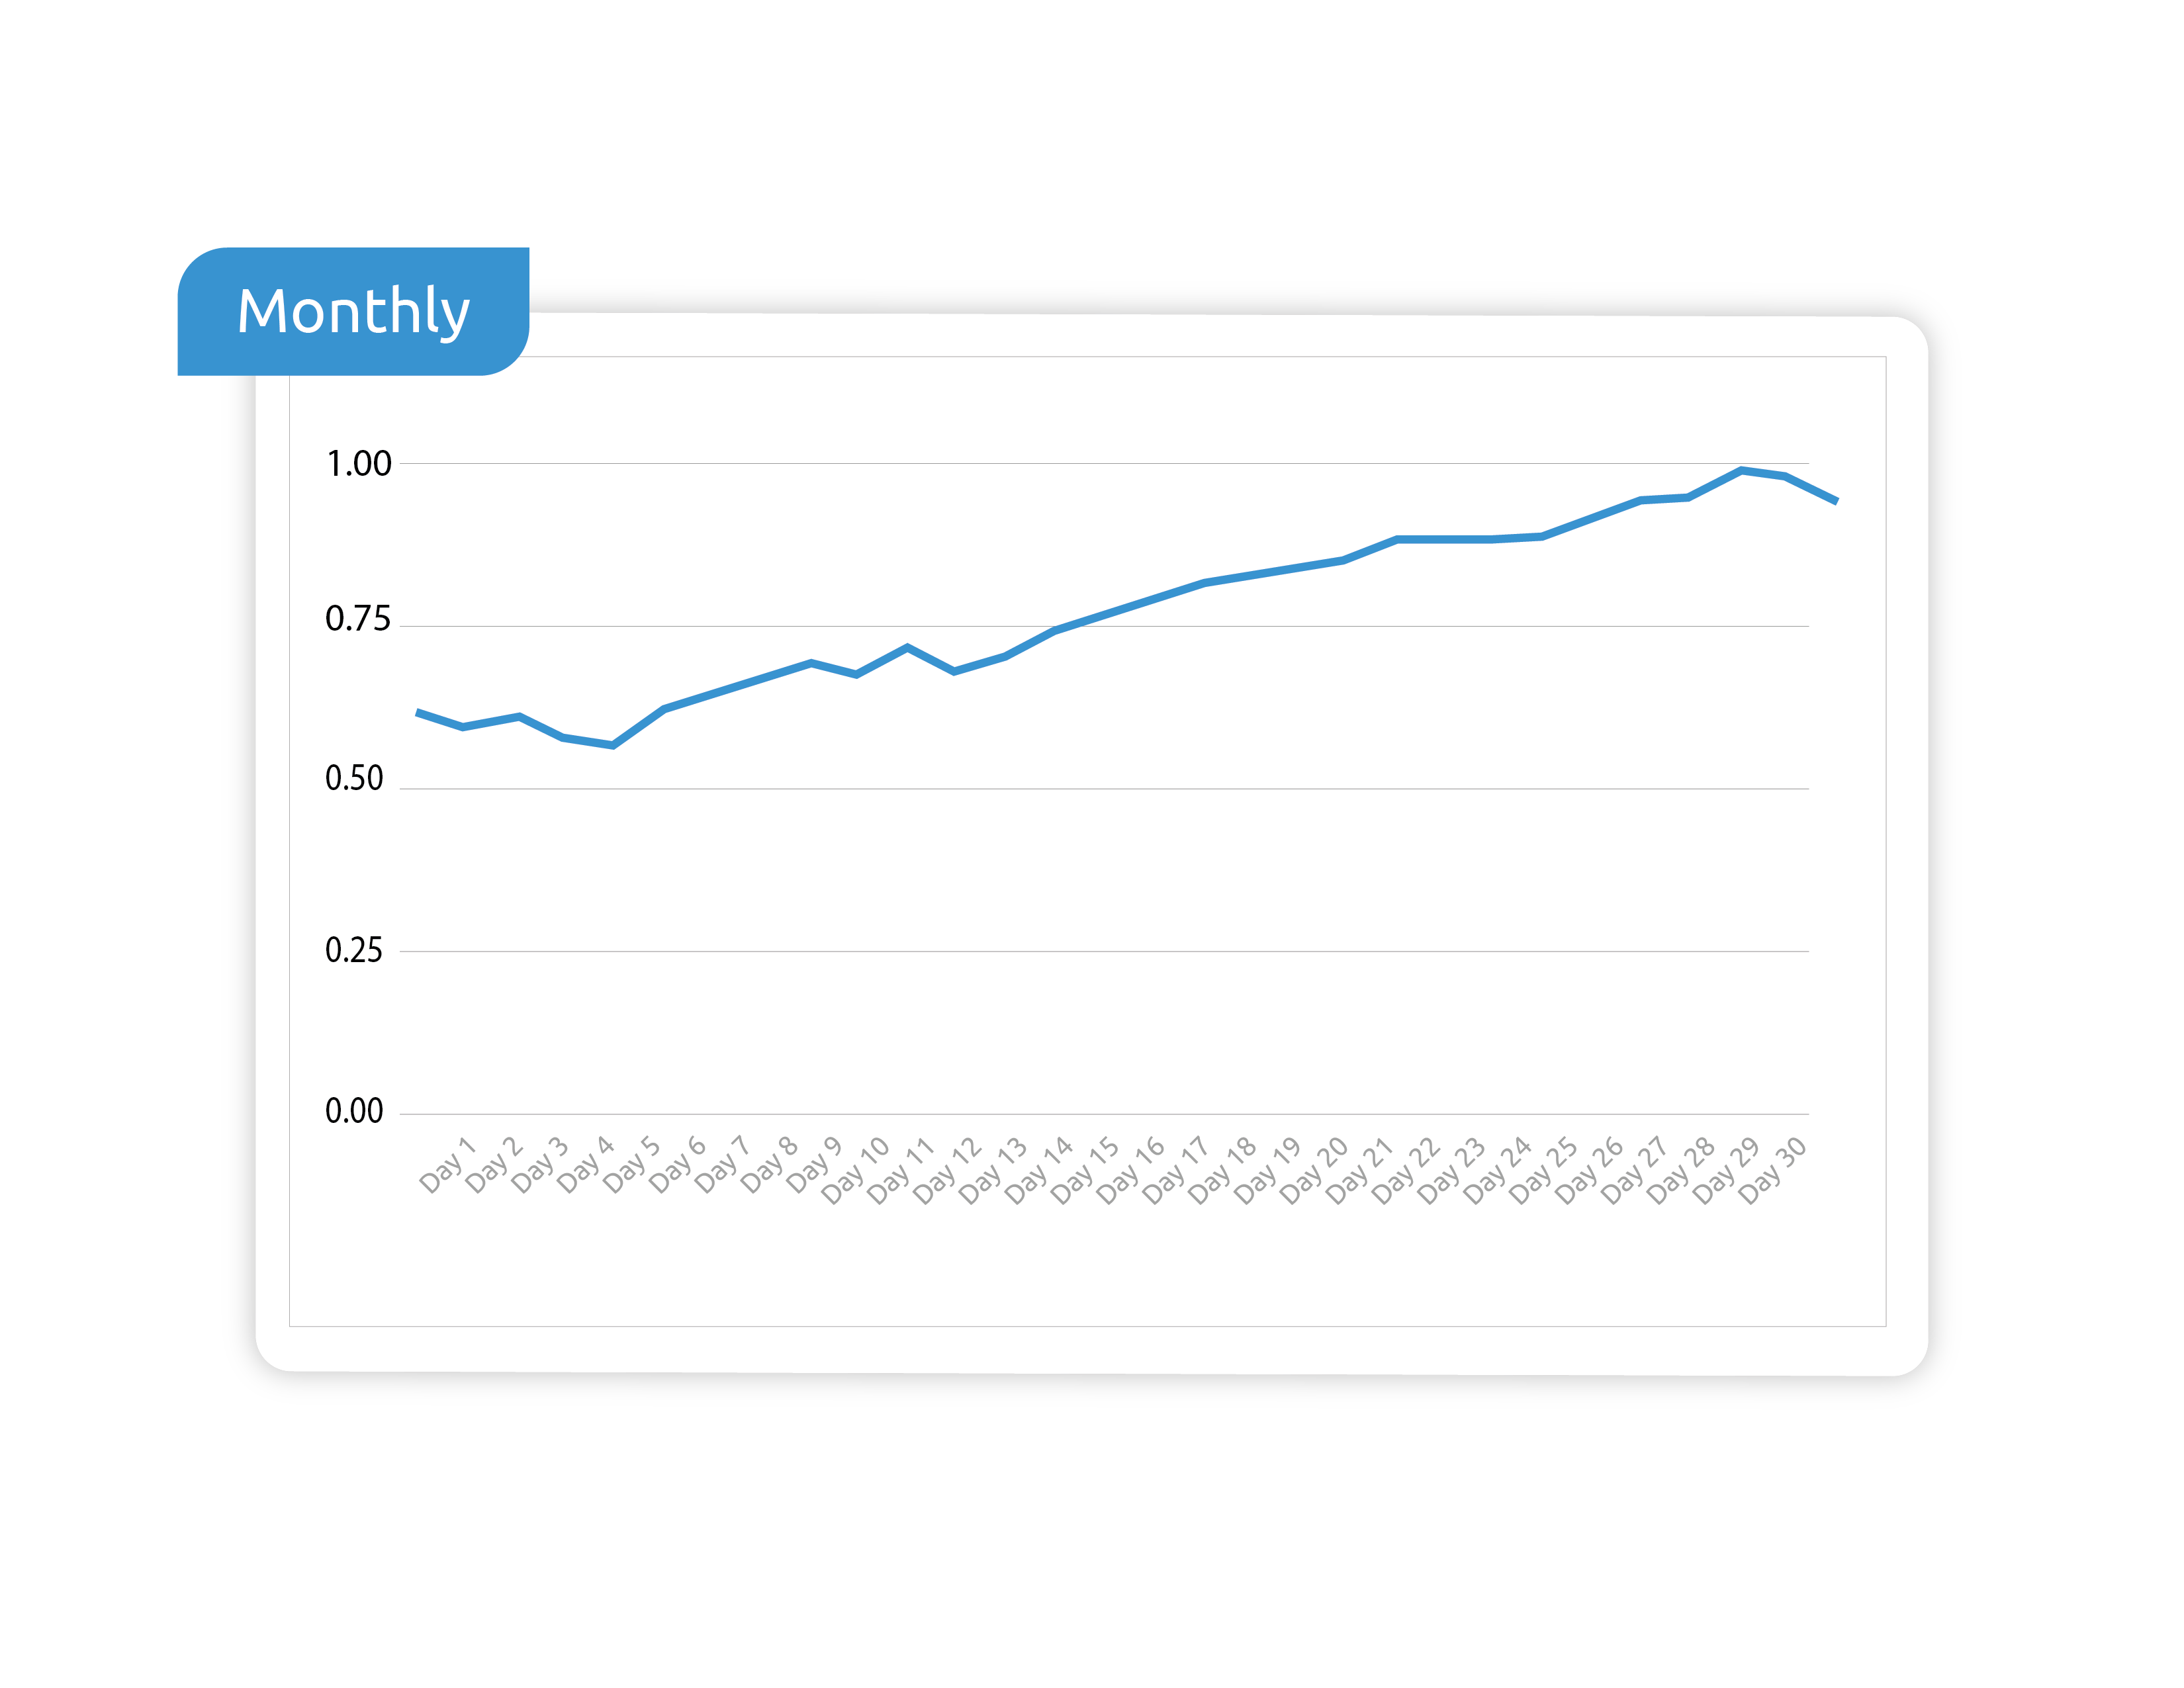
As you can see, there is a slight change in rhythm to this pattern.
The end of the crescendo tends to hit before the month ends, leading to a performance drop before the curtain falls on the calendar month.
This means that the energy period of advertising often dips anywhere from 12 to 36 hours before the month officially closes. By understanding this pattern, you can anticipate these changes to make the most out of each energetic peak and quiet lull in monthly performance.
Weekly Ad Spending Patterns
While monthly, quarterly, and yearly ad spend patterns feel like they come from the same symphony, weekly patterns are a different beast altogether.
Each week, as it relates to programmatic spending, plays a unique tune. Imagine every website or app as an instrument, each with its own sound and timbre.
For example, a website catering to students with educational content might echo the flow of the school week. Thursday nights are busy, as students rush to wrap up homework. You can say the same for Sunday when students are gearing up for the start of the new week.
However, Friday night and Saturday are a different story. With students out for the weekend, there’s no homework, or at least significantly less, to be done — meaning traffic drops.
Compare this to a video game companion site, which might play a contrasting melody, surging on the weekend, when people have more free time, and lulling on weekdays while they are at school or work.
Imagine the pool of supply for each site as an audience. On Monday, an educational site like SparkNotes might have a concert hall filled with 9 million impressions, while Saturday may only draw a crowd of 200,000.
This variation in 'audience' size influences the 'ticket price' or auction competitiveness. If the pool of available impressions is smaller, CPM may increase due to heightened competition.
Daily and Hourly Ad Spending Patterns
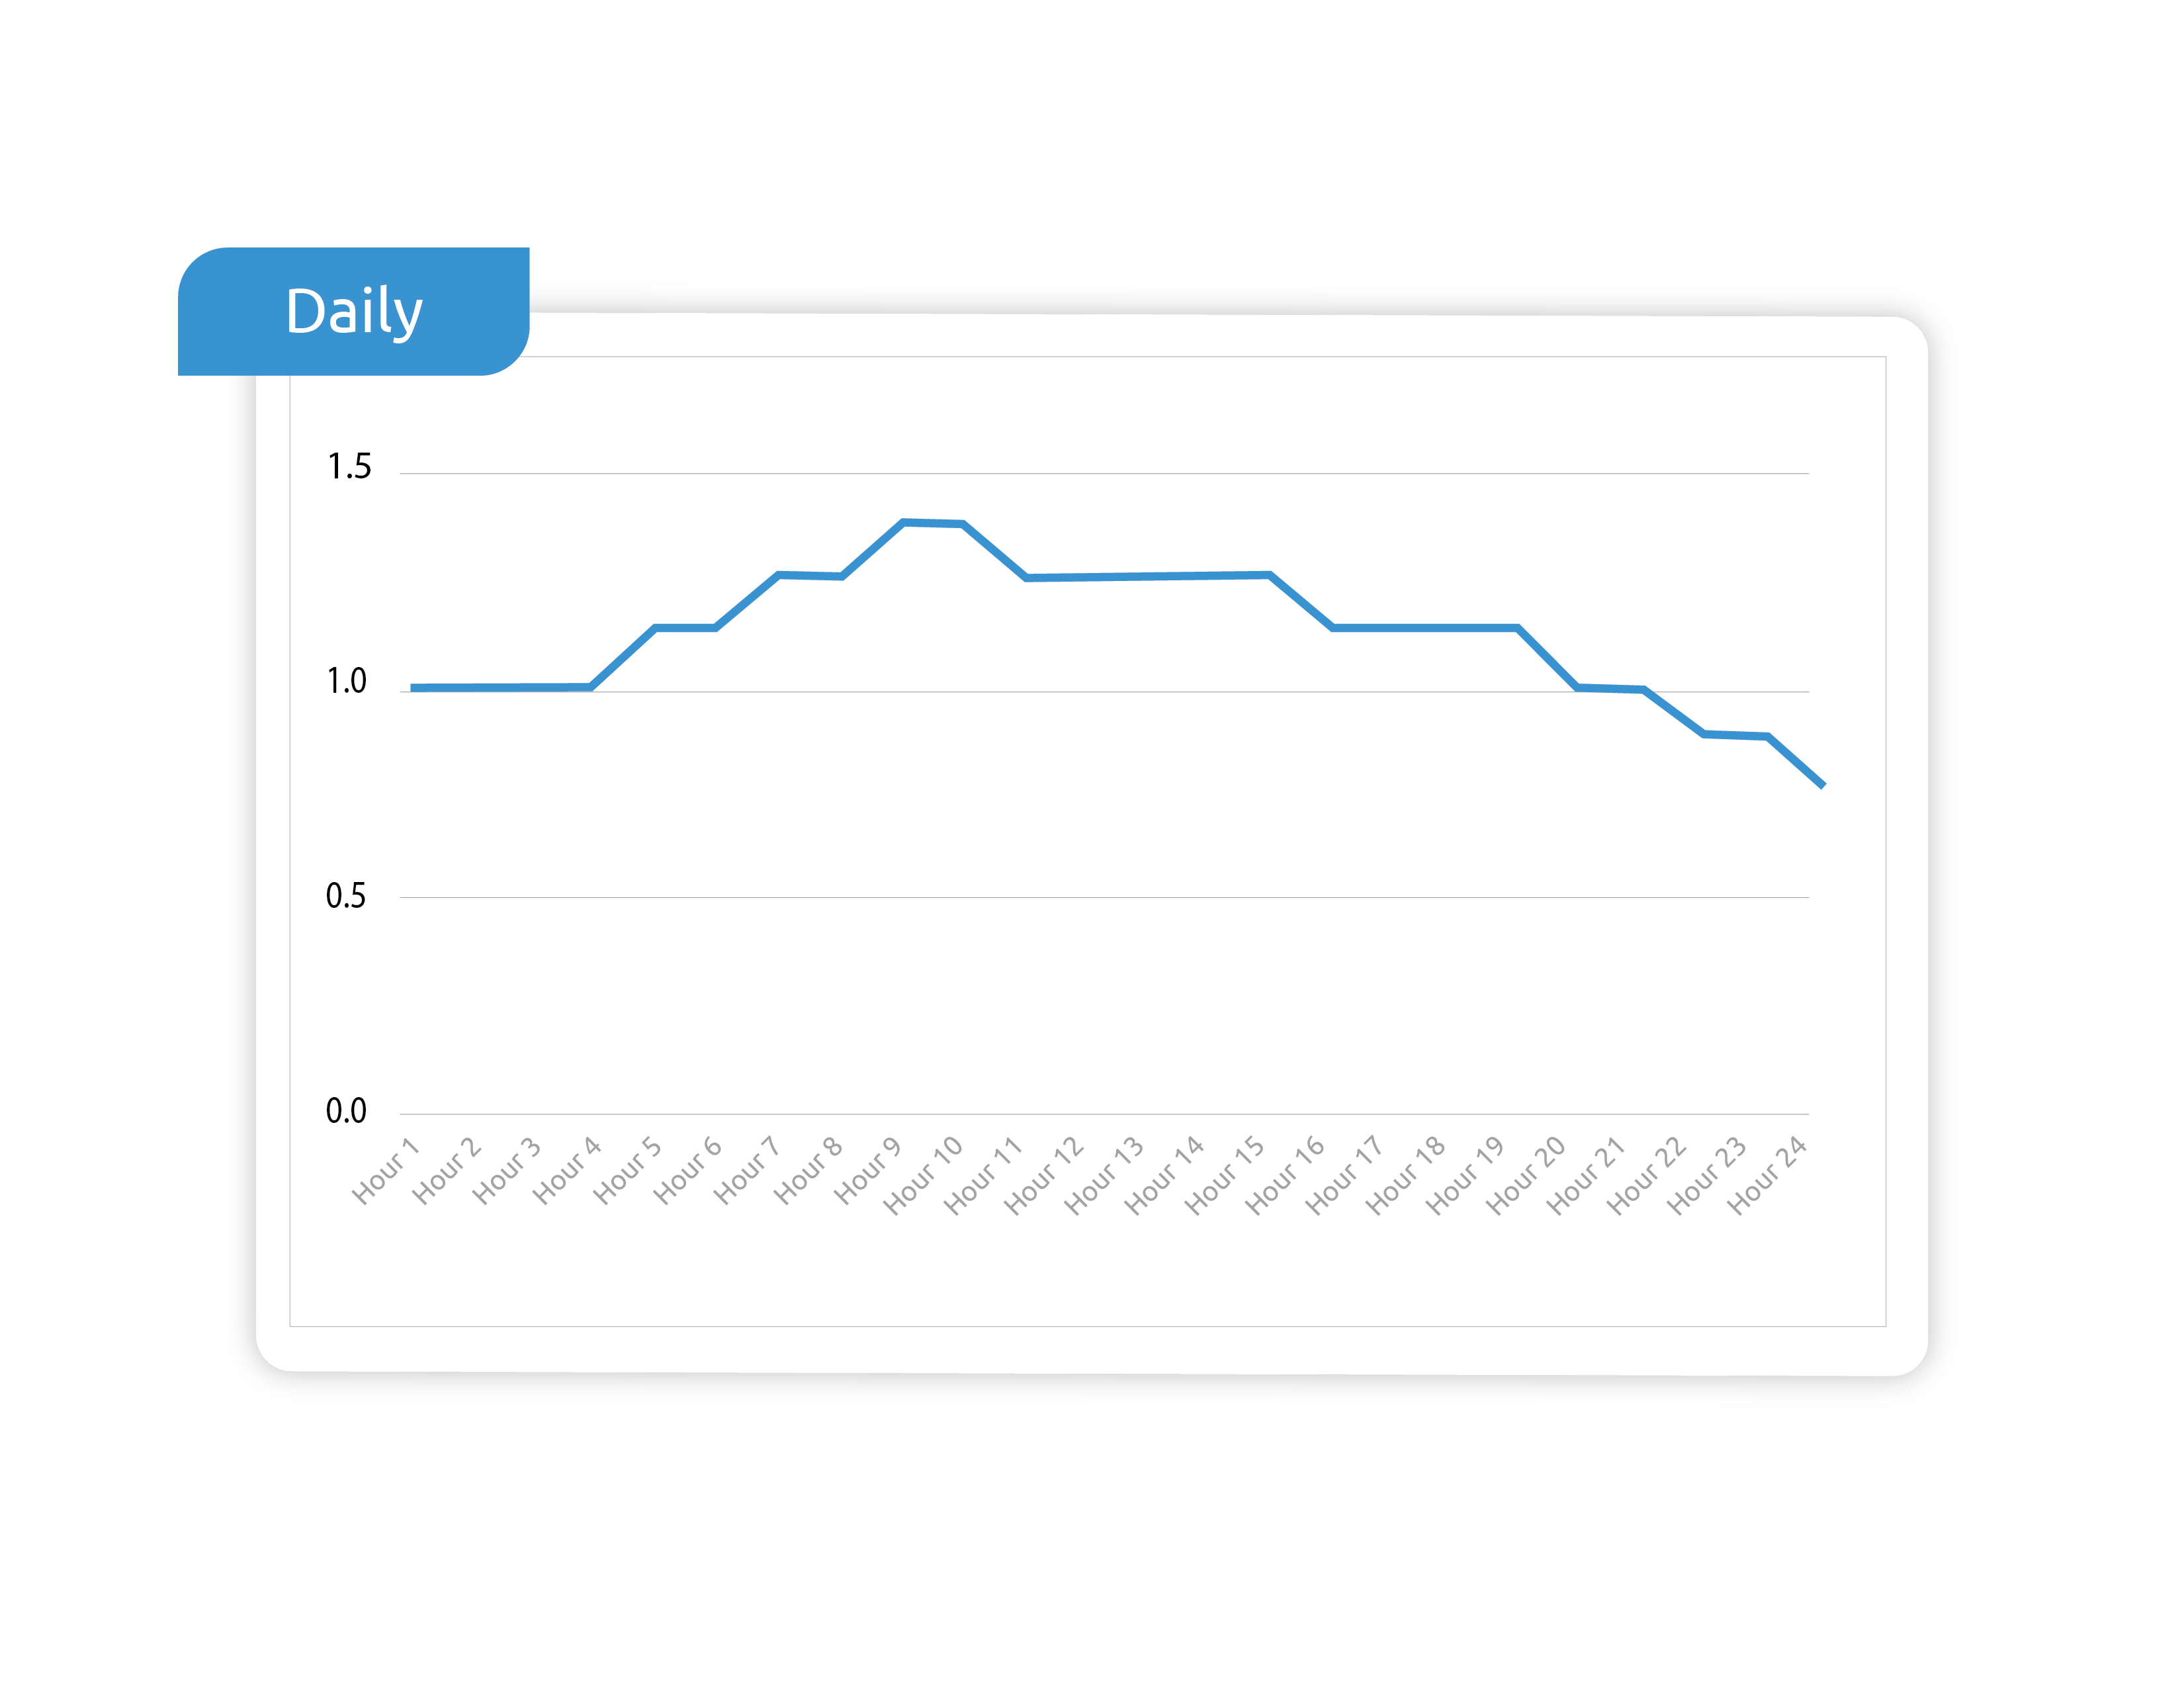
When it comes to daily advertising spend, there are a few factors that play a critical role in understanding patterns:
- Daily media budgets: Because budgets tend to reset at midnight, you’ll often see a sudden surge in competition and prices at 12:01.
- Audience engagement: Audiences will engage with digital ads differently throughout the day, tending to stick to desktops during the day and switching to smartphones in the evening.
- Audience attention: Fresh eyes during the morning are better for ad performance relative to later-day browsers who’ve seen hundreds of ads by the time the evening rolls around.
- Geographies: If you're exclusively looking at U.S. CPM rates, you may have a skewed perspective. But if your audience mix includes different geographies, you'll encounter diverse patterns.
Another key factor in these daily patterns is the nuances within each hour.
For example, if an advertiser sets a frequency cap, it may be eligible to bid again once the clock ticks past the cap limit, influencing the CPM.
Audiences have varying energy levels and preferences too.
Some advertisers might want the peak office hours for desktop traffic, while others might opt for late afternoon mobile ad engagement. Knowing when to play the right note at the right time is the key to striking the perfect chord with your target audience.
Chart Your Seasonal Success with Playwire's Programmatic Advertising Solutions
Feel like the beat’s moving too fast? Don’t sweat it; that’s why Playwire is here.
We're your all-in-one programmatic advertising maestro, conducting the symphony of video advertising tools, innovative tech, and a team of dedicated professionals — all focused on helping both publishers and advertisers hit the right notes with their ad strategy.
Ready to optimize your advertising performance? Get in touch with us today to make your programmatic ad symphony a masterpiece.
